
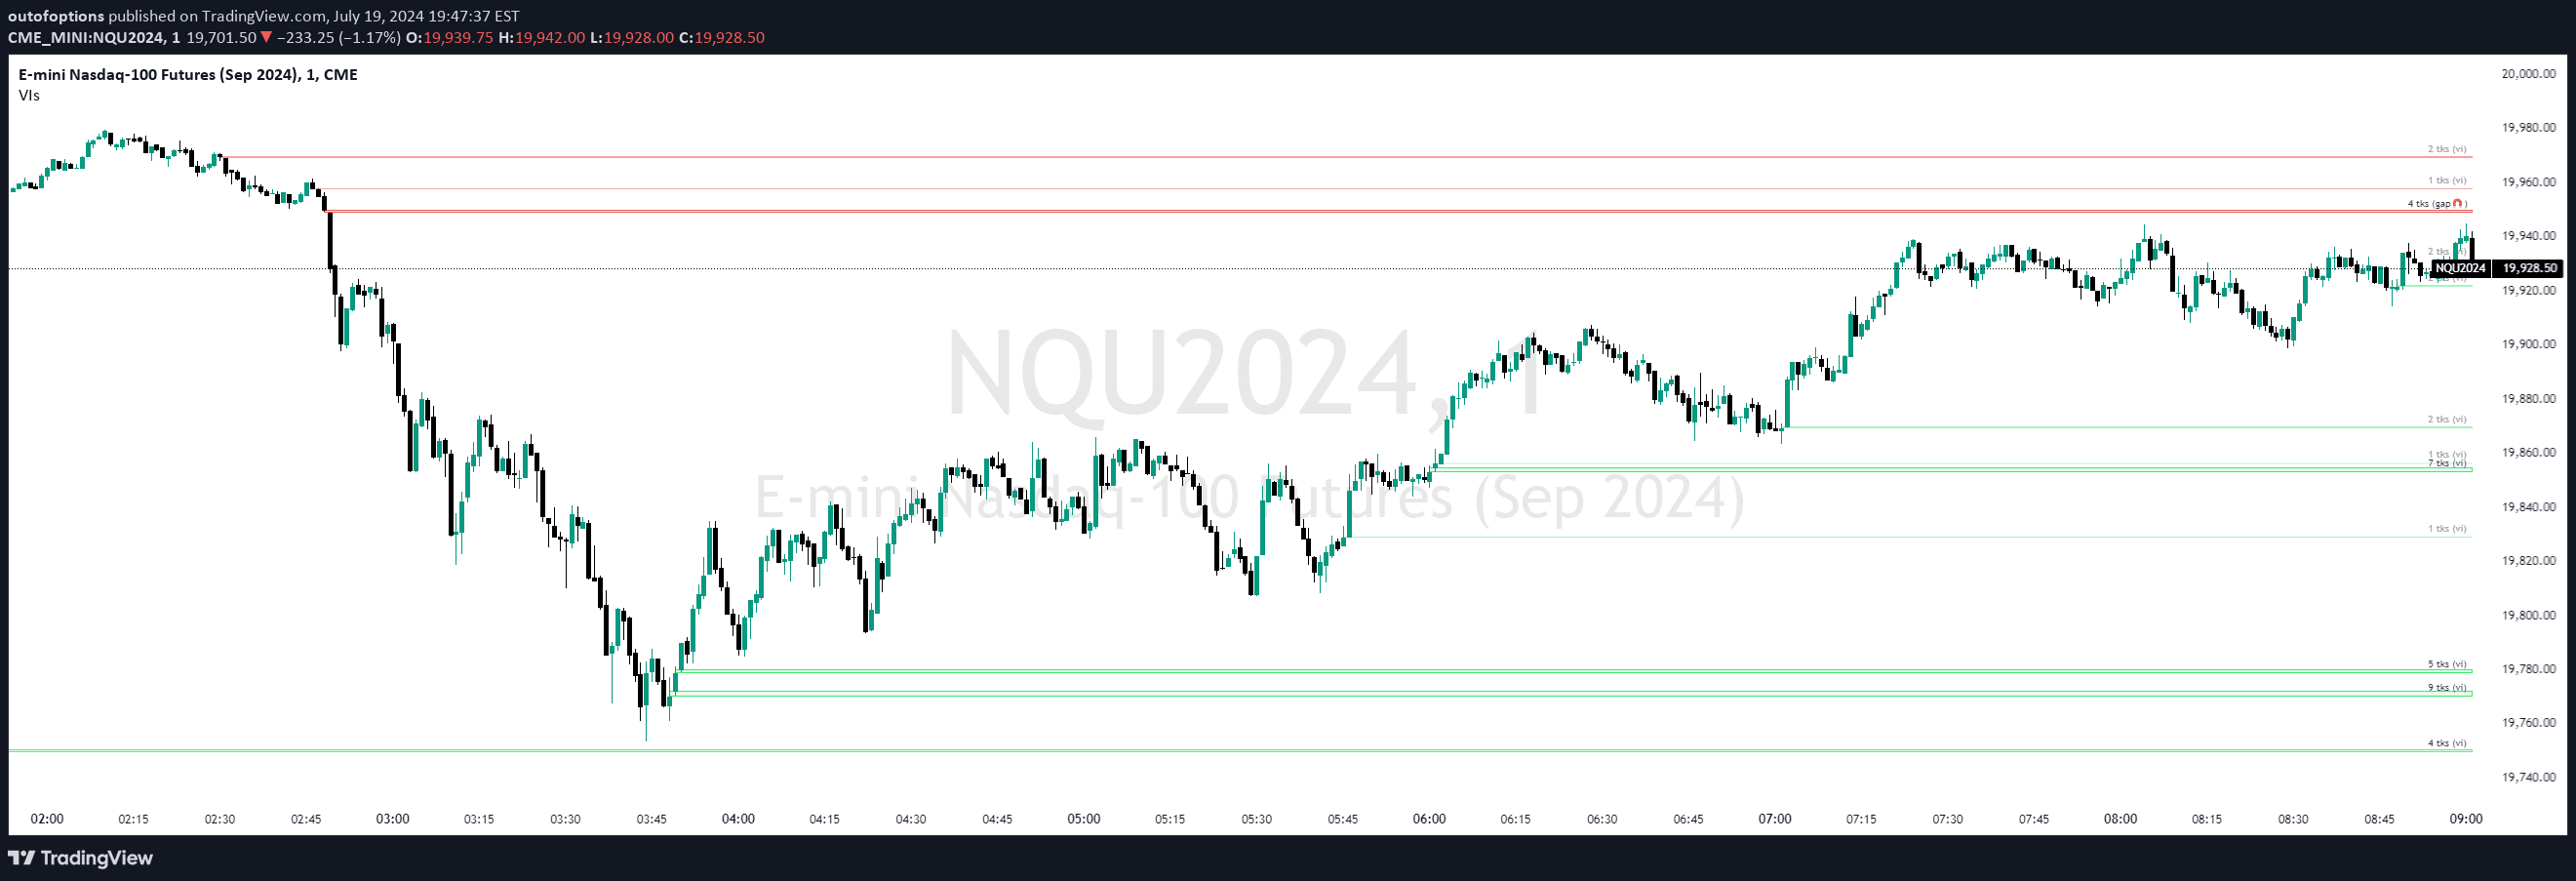
A Pine script indicator that identifies price inefficiencies through Volume Gaps and Imbalances, highlighting potential liquidity zones where price may seek rebalancing and future movement.
Explore complementary indicator rolesHow it works
The indicator tracks Volume Gaps and Imbalances by analyzing the relationship between consecutive candle wicks and bodies. For bullish gaps, it identifies zones where the highest previous candle price differs from the lowest current candle price, while bearish gaps do the opposite.
The system automatically removes mitigated gaps and displays only recent, valid imbalances up to a user-defined limit. Each gap is marked with a box, color-coded for visibility, and includes a tick measurement to indicate the strength of the potential liquidity zone.
Why it may be useful
Volume Gaps and Imbalances represent critical zones of price inefficiency that often act as powerful magnets for future price movement. By identifying these areas, traders can anticipate potential reversals, entry points, and take-profit targets based on market rebalancing principles.
The indicator provides a visual framework for understanding hidden market dynamics, allowing traders to make more informed decisions about potential price trajectories and liquidity-driven movements.
When to explore it
This indicator is most effective in markets with clear trending or ranging conditions where price tends to revisit previous inefficient zones. It works particularly well in timeframes that allow for sufficient candle formation and liquidity analysis, such as intraday and swing trading charts.
Traders should use this tool in conjunction with other technical analysis methods, focusing on markets with consistent volume and clear price action patterns to maximize its predictive potential.
Keep exploring
What we’ve verified
Access, alerts and repainting behaviour have not been independently verified for this indicator. Check the creator’s current publication and settings.
General descriptions and classifications are recovered research. Verified details above identify the specific checks we have completed. Check the creator’s current publication for later changes.




