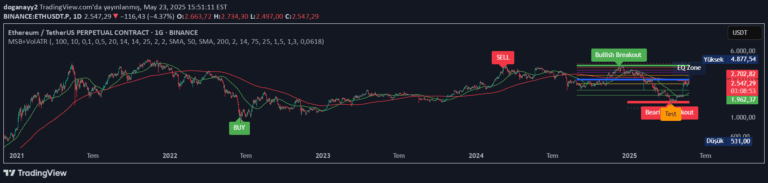
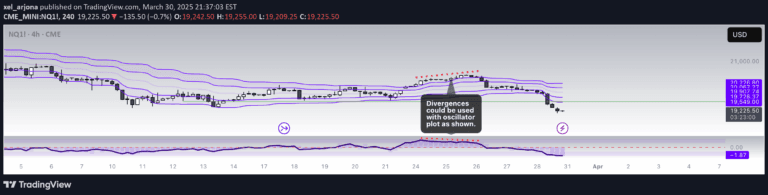
A volumetric fair value gap indicator that identifies significant price discrepancies using volume and price action, highlighting potential trading opportunities with color-coded visual signals.
Explore complementary indicator rolesHow it works
The Volumetric Fair Value Gaps (VFVG) indicator operates by comparing the current candle's price range against historical averages over a user-defined period. It calculates significant price gaps that are substantiated by volume, going beyond typical price action analysis.
The indicator identifies bullish gaps when the current low is higher than the second previous high after surpassing a predefined threshold, and bearish gaps when the current high is below the second previous low. By using dual confirmation through volume and price deviation, the indicator minimizes false signals and enhances the reliability of identified trading opportunities.
Why it may be useful
The VFVG indicator provides traders with a sophisticated tool for identifying high-probability trading opportunities by integrating volume analysis with price action. By highlighting significant price gaps, traders can gain deeper insights into market dynamics and potential trend reversals or continuations.
Unlike traditional indicators, this tool offers a more nuanced approach to market analysis by considering both price movement and trading volume. This comprehensive methodology helps traders make more informed decisions, reduce false signals, and potentially improve their overall trading strategy and risk management.
When to explore it
The Volumetric Fair Value Gaps indicator is most effective in markets with clear price movements and sufficient trading volume, such as major currency pairs, stock indices, and liquid commodities. Traders should apply this indicator in timeframes that allow for meaningful volume analysis, typically ranging from 5-minute to daily charts.
Ideal usage includes identifying potential entry and exit points during trending markets, confirming trend strength, and detecting possible price reversals. Traders should combine this indicator with other technical analysis tools to validate signals and enhance overall trading decision-making.
Keep exploring
What we’ve verified
Access, alerts and repainting behaviour have not been independently verified for this indicator. Check the creator’s current publication and settings.
General descriptions and classifications are recovered research. Verified details above identify the specific checks we have completed. Check the creator’s current publication for later changes.