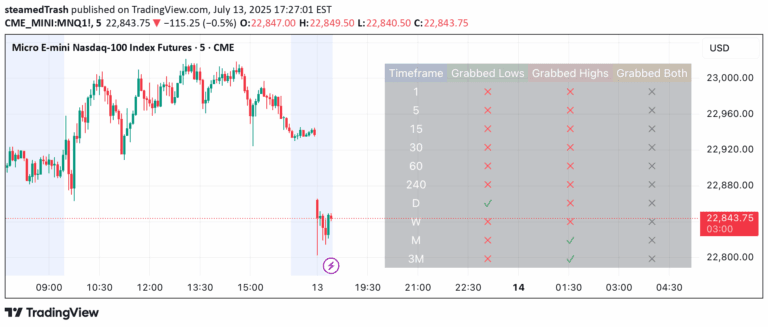
The Price Percentage Breakout by Time Period (P%BTP) indicator identifies potential trading opportunities by measuring price change percentage relative to a historical lookback period.
Explore complementary indicator rolesHow it works
The P%BTP indicator calculates the percentage change between open and close prices for each candle within a specified lookback period. It compares the current percentage change against the highest percentage change observed during that timeframe, generating potential breakout signals.
When the current price percentage change meets or exceeds the historical highest percentage change, the indicator triggers a signal. The bars are then color-coded to visually represent bullish or bearish breakout conditions, allowing traders to quickly identify potential trading opportunities.
Why it may be useful
The Price Percentage Breakout by Time Period indicator provides traders with a systematic approach to identifying significant price movements and potential trend reversals. By quantifying price changes and comparing them to historical performance, traders can gain insights into momentum shifts and potential trading opportunities.
This indicator helps traders objectively assess market dynamics by transforming subjective visual pattern recognition into a more structured, mathematically-driven analysis. It offers a clear, visual representation of price momentum that can be integrated with other technical analysis tools to enhance trading decision-making.
When to explore it
The P%BTP indicator is most effective in markets with clear directional movements and identifiable momentum shifts. It performs well in volatile markets where price percentage changes can provide meaningful insights into potential trend reversals or continuations.
Traders should use this indicator in conjunction with other technical analysis tools to confirm signals and validate potential trade setups. It is particularly useful for short-term trading strategies that focus on capturing quick price movements and momentum-based opportunities.
Keep exploring
What we’ve verified
Access, alerts and repainting behaviour have not been independently verified for this indicator. Check the creator’s current publication and settings.
General descriptions and classifications are recovered research. Verified details above identify the specific checks we have completed. Check the creator’s current publication for later changes.