
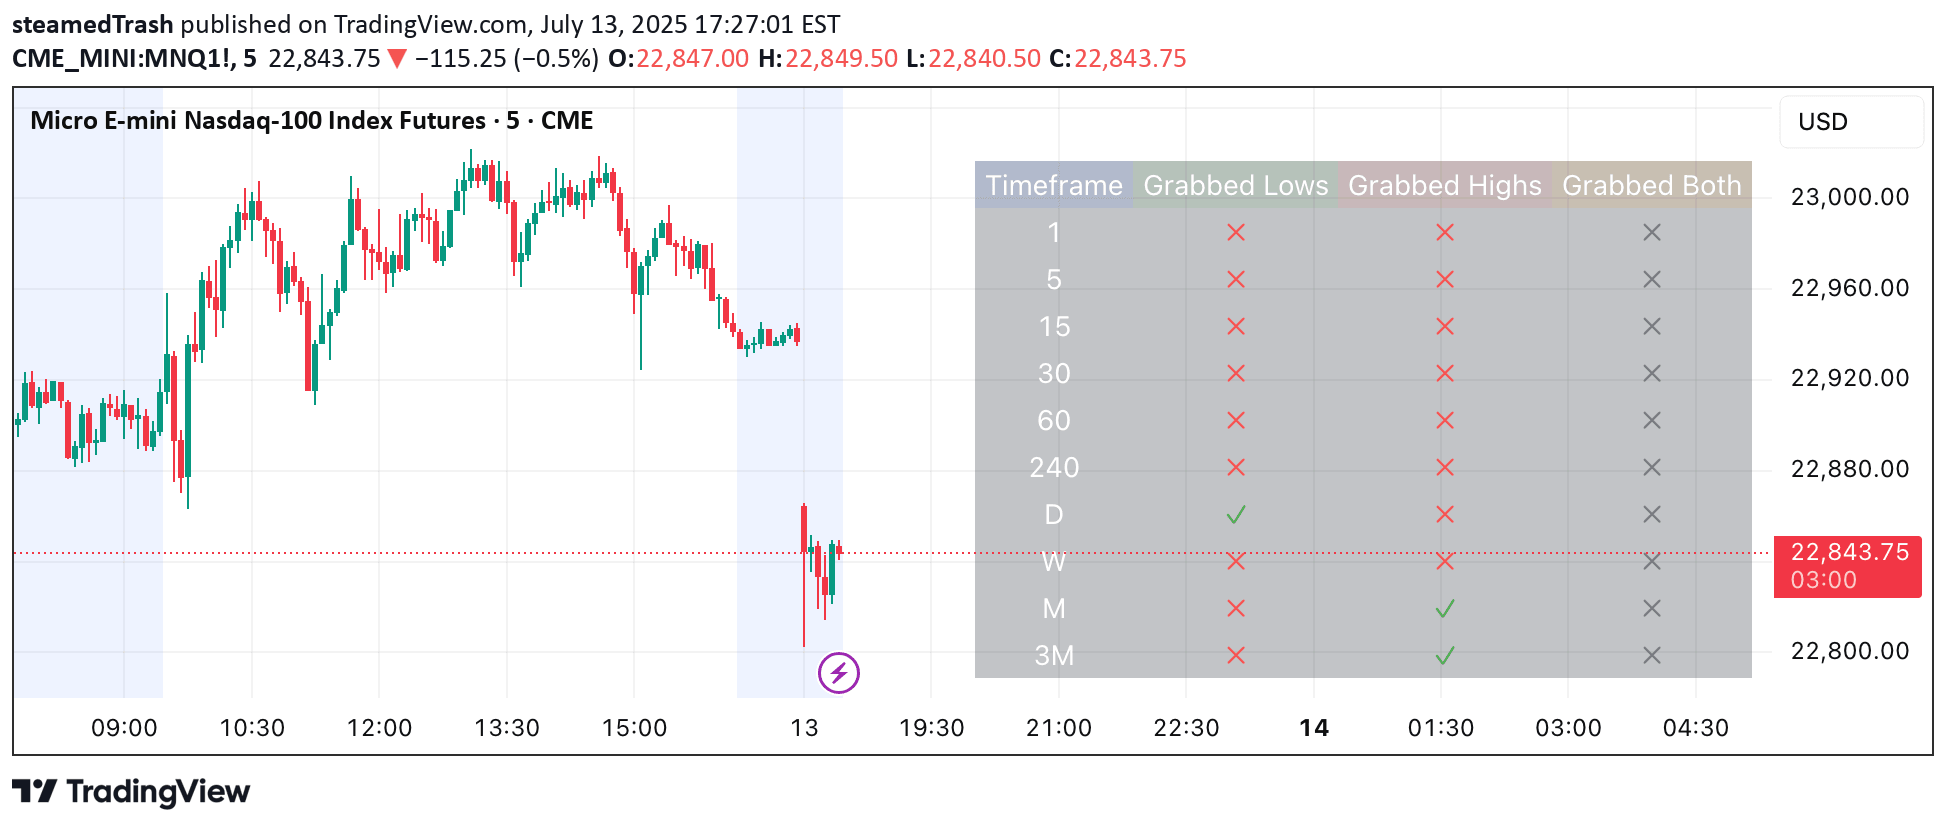
A multi-timeframe price action analysis tool that tracks price interactions with previous candle ranges across four different timeframes to generate bullish and bearish signals.
Explore complementary indicator rolesHow it works
The indicator scans four customizable timeframes simultaneously to analyze price action relative to previous candles' ranges. It detects specific price movements such as price grabbing previous candle highs or lows and returning inside the range, which generates bullish or bearish signals.
The system tracks multiple scenarios including price moving above previous high, below previous low, and calculates percentage-based bullish and bearish indicators for each timeframe. It creates a visual dashboard with color-coded signals to help traders quickly interpret potential market movements.
Why it may be useful
This price action analysis provides traders with a comprehensive view of market dynamics across multiple timeframes, enabling more informed trading decisions. By tracking price interactions with previous candle ranges, traders can identify potential trend reversals and momentum shifts before they become obvious.
The indicator's flexibility in timeframe selection and confirmation settings allows traders to customize their analysis to match their specific trading style and risk tolerance. Its visual dashboard helps quickly interpret complex price action scenarios, reducing cognitive load during fast-moving market conditions.
When to explore it
This signal works best in markets with clear price action and defined candle ranges, such as forex, stocks, and cryptocurrencies. It is particularly effective during periods of consolidation or when price is testing previous support and resistance levels across multiple timeframes.
Traders should use this indicator as a supplementary tool alongside other technical analysis methods, not as a standalone trading strategy. It is most useful for identifying potential entry and exit points, but should always be combined with additional confirmation from other indicators and fundamental market analysis.
Keep exploring
What we’ve verified
Access, alerts and repainting behaviour have not been independently verified for this indicator. Check the creator’s current publication and settings.
General descriptions and classifications are recovered research. Verified details above identify the specific checks we have completed. Check the creator’s current publication for later changes.


