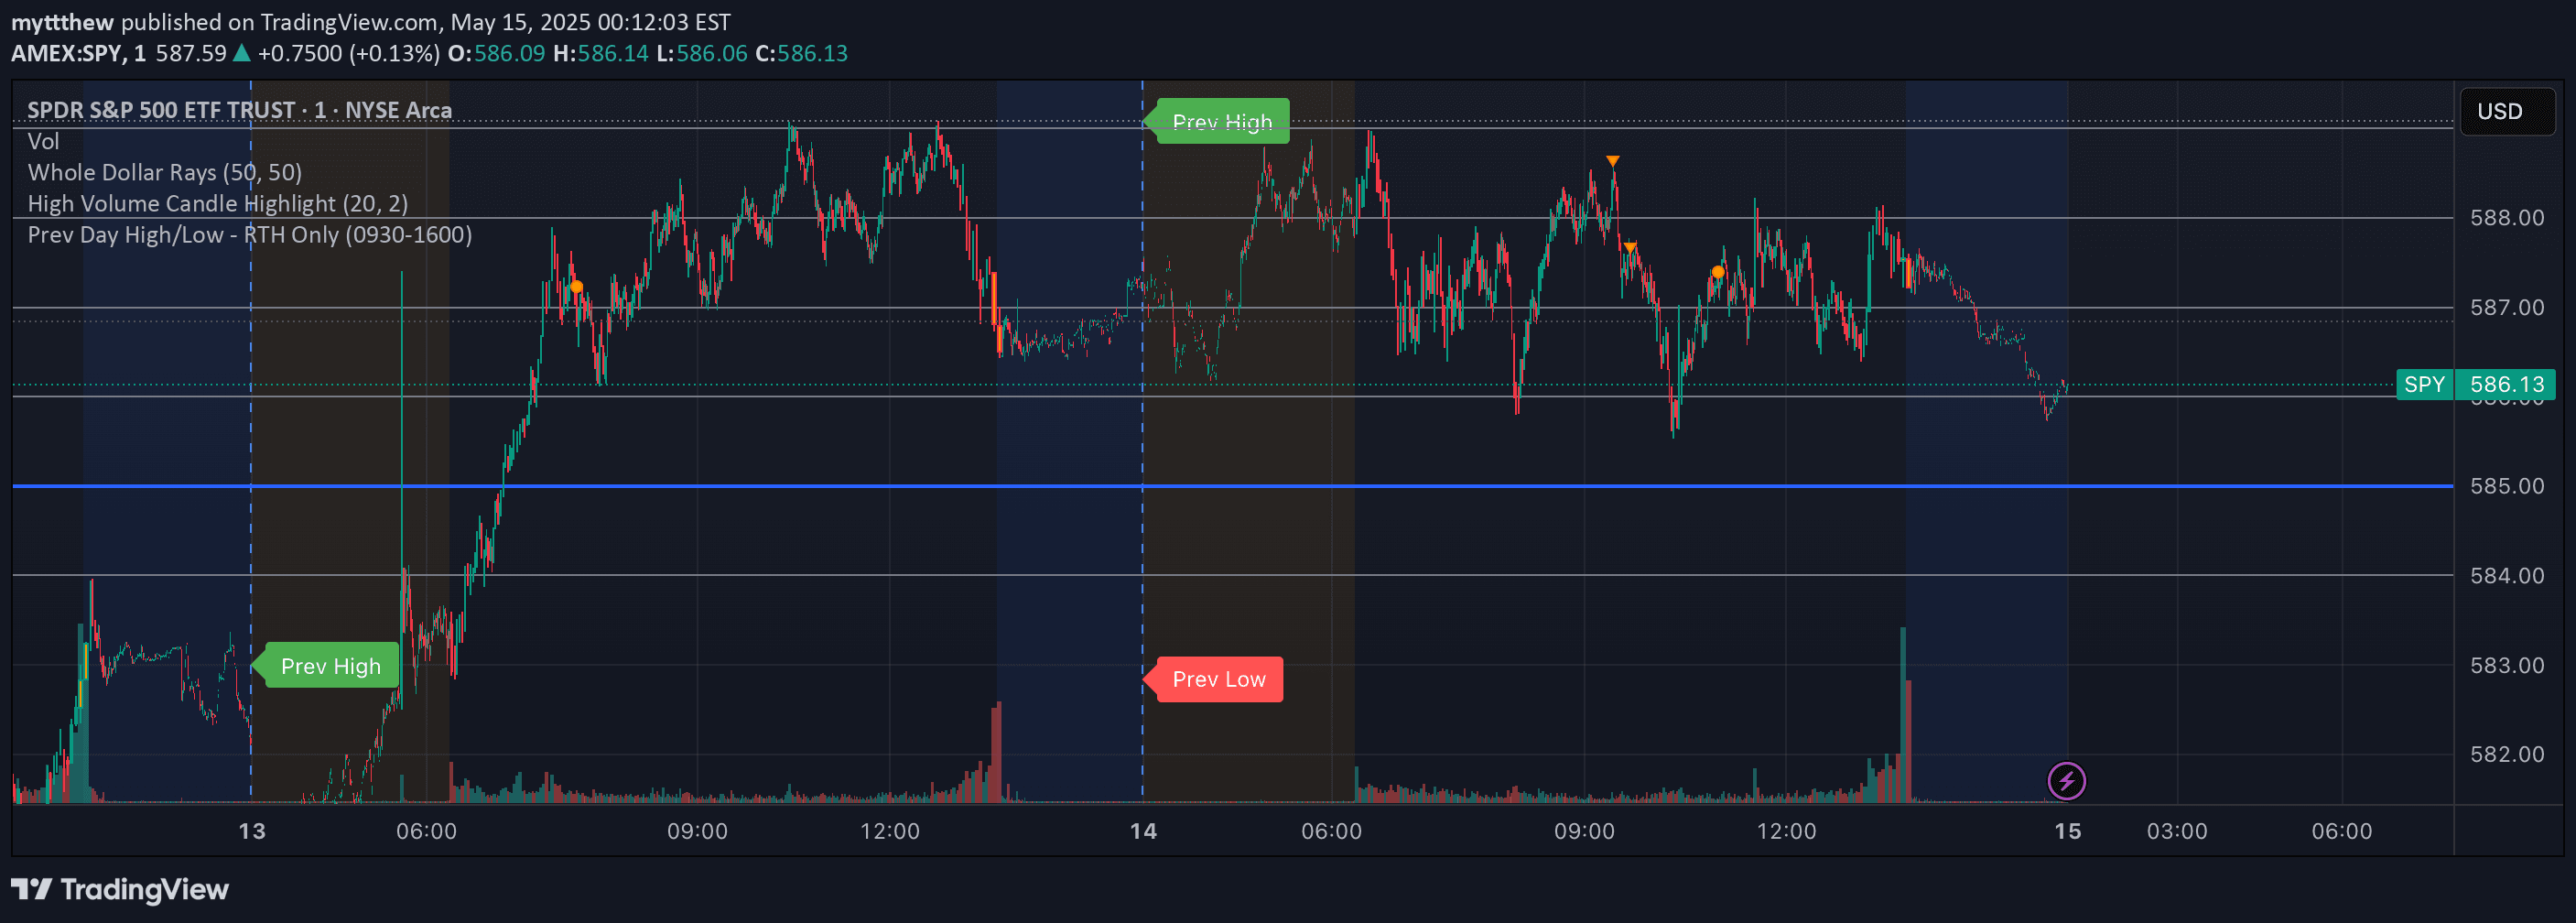
A custom indicator that projects rays from the prior day's high and low prices, helping traders visualize key support and resistance levels from the previous trading day.
Explore complementary indicator rolesHow it works
The Prior Day High and Low Rays indicator operates by identifying the highest and lowest price points from the previous trading day. These specific price levels are then used as anchor points to extend rays horizontally to the right side of the chart, creating visual reference lines for potential support and resistance zones.
As the rays extend across the current trading day's chart, they provide traders with a clear visual representation of the previous day's price extremes. The rays remain constant throughout the current trading session, allowing traders to quickly assess how current price action relates to the prior day's key price levels.
Why it may be useful
The Prior Day High and Low Rays are crucial for traders seeking to understand market context and historical price dynamics. By highlighting the previous day's extreme price points, the indicator helps traders identify potential areas where price might respect or react to these significant levels, which can serve as critical decision-making points for entries and exits.
These rays provide a simple yet powerful visual tool that transforms abstract price history into actionable trading insights. They help traders quickly interpret market structure, recognize potential support and resistance zones, and make more informed trading decisions based on the previous day's price action.
When to explore it
The Prior Day High and Low Rays are most effective in volatile and trending markets where historical price levels carry significant psychological weight. Day traders and scalpers can particularly benefit from this indicator, as it provides immediate context about the previous day's price range and potential key trading levels.
Traders should use these rays in conjunction with other technical analysis tools to confirm potential trade setups. They are especially useful during periods of market uncertainty, when traders need clear visual references to understand recent price behavior and potential future market movements.
Keep exploring
What we’ve verified
Access, alerts and repainting behaviour have not been independently verified for this indicator. Check the creator’s current publication and settings.
General descriptions and classifications are recovered research. Verified details above identify the specific checks we have completed. Check the creator’s current publication for later changes.