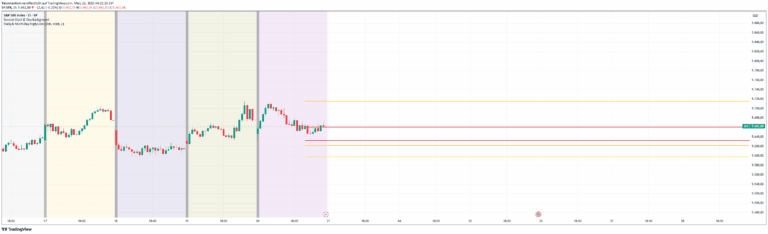
A dynamic indicator tracking previous day's Regular Trading Hours high and low levels, displaying them strategically during the next trading session for precise market analysis.
Explore complementary indicator rolesHow it works
The indicator automatically identifies the previous day's Regular Trading Hours (RTH) high and low price levels during a specific timeframe from 09:30 to 16:00 New York time. It calculates these key levels by tracking price movements within the designated RTH session, creating precise horizontal lines that represent the previous day's price range.
These lines are strategically displayed only during the following day's RTH session, ensuring minimal chart clutter and maintaining a clean visual representation. The lines can be accompanied by optional 'Prev High' and 'Prev Low' markers at market open, providing traders with clear reference points for potential trading decisions.
Why it may be useful
By highlighting critical price levels from the previous trading session, this indicator helps traders identify potential support and resistance zones that are often respected by institutional and algorithmic trading flows. These levels provide valuable insights into market sentiment and potential price reversal or continuation points, enabling more informed trading strategies.
The indicator's minimal approach reduces chart complexity while maintaining focus on the most relevant price information. By automatically tracking and displaying these key levels, traders can quickly assess market dynamics and make more precise entry and exit decisions without being overwhelmed by excessive technical information.
When to explore it
This indicator is most effective for intraday and 0DTE options traders who rely on previous session's key levels for identifying potential trading opportunities. It works best in liquid markets with consistent trading patterns, such as major stock indices, futures, and high-volume stocks where institutional and algorithmic trading activities are prominent.
Traders can utilize this tool for breakout trades, reversal setups, and identifying support/resistance confluence. It is particularly useful during volatile market conditions where understanding previous session's price extremes can provide critical insights into potential market movements and trading strategies.
Keep exploring
What we’ve verified
Access, alerts and repainting behaviour have not been independently verified for this indicator. Check the creator’s current publication and settings.
General descriptions and classifications are recovered research. Verified details above identify the specific checks we have completed. Check the creator’s current publication for later changes.