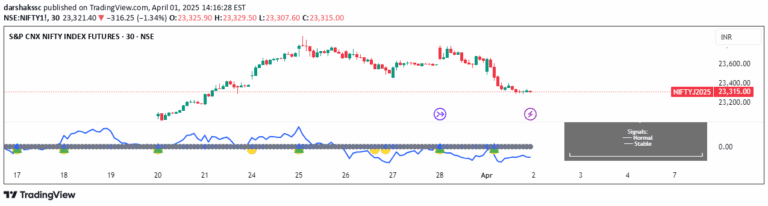
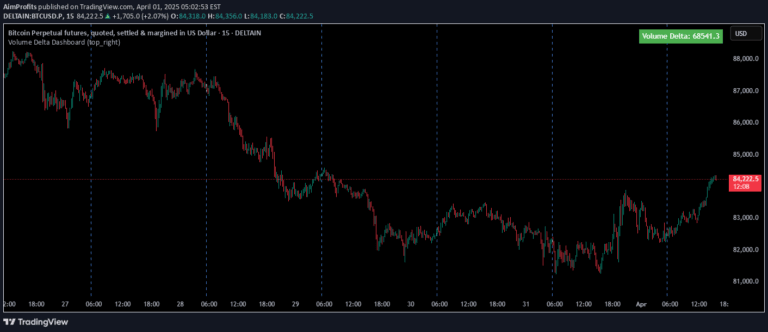
An advanced volume-based indicator that analyzes net buying and selling volumes to detect market sentiment shifts and generate precise trading signals across different timeframes.
Explore complementary indicator rolesHow it works
The L1 Net Volume Difference indicator calculates volume dynamics by comparing buy and sell volumes across specific timeframes, typically using 5-minute price bars. It accumulates volume data and applies proprietary algorithms to detect shifts in market sentiment by tracking the differential between buying and selling pressures.
The system employs moving averages and standardized deviation formulas to generate precise net volume measurements. It implements the Arithmetic Mean Line Algorithm (AMLA) to smooth volume data and enhance interpretability, ensuring consistent alignment with established statistical principles for accurate market analysis.
Why it may be useful
This indicator provides traders with critical insights into market sentiment by revealing underlying buying and selling pressures that might not be immediately apparent from price action alone. By quantifying volume differences, traders can gain a more nuanced understanding of potential trend reversals and market momentum before they become visually obvious.
The signal's ability to dynamically detect transitions between buyer and seller dominance enables traders to make more informed decisions. Its adaptive thresholds and sophisticated sentiment detection algorithms help minimize erroneous signals, offering a robust tool for understanding short-term market dynamics and potential trading opportunities.
When to explore it
The L1 Net Volume Difference indicator is most effective in liquid markets with consistent trading volumes, such as major stock indices, forex pairs, and actively traded commodities. It performs optimally during periods of moderate market volatility where volume shifts can provide meaningful insights into potential price movements.
Traders should prioritize using this indicator during regular trading hours when market participation is highest and volume data is most representative. It is particularly useful for identifying short-term sentiment changes, confirming trend strengths, and providing early warning signals for potential market reversals across various trading timeframes.
Keep exploring
What we’ve verified
Access, alerts and repainting behaviour have not been independently verified for this indicator. Check the creator’s current publication and settings.
General descriptions and classifications are recovered research. Verified details above identify the specific checks we have completed. Check the creator’s current publication for later changes.