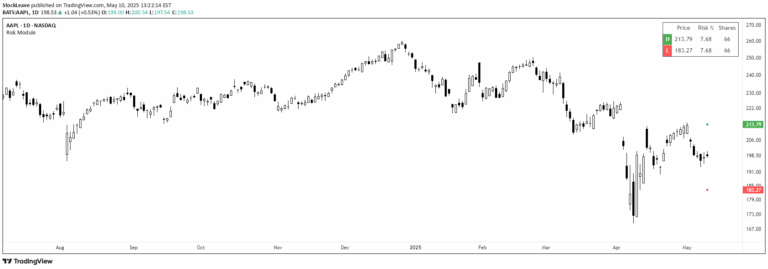
A trading tool that scans recent price bars to identify and visualize the highest high and lowest low within a customizable range, helping traders analyze market volatility and potential price extremes.
Explore complementary indicator rolesHow it works
The script analyzes a user-defined number of recent price bars, typically between 100 and 1000, to identify the absolute highest and lowest price levels during that period. It automatically detects the extreme price points by examining the wicks of each candle, tracking the highest high and lowest low within the specified timeframe.
Once the extreme levels are identified, the script generates visual indicators on the chart, including dotted green horizontal lines at the highest and lowest price points. It also calculates and displays the percentage range between these extreme levels, providing traders with a quick and intuitive understanding of recent price movement and market volatility.
Why it may be useful
Understanding price extremes is crucial for traders seeking to make informed decisions about market direction, potential reversals, and trading opportunities. By highlighting the highest and lowest price points, traders can quickly gain insights into recent market behavior, volatility, and potential support and resistance levels.
The visual representation of price extremes helps traders quickly assess market conditions, identify potential breakout zones, and develop more strategic entry and exit points. This tool provides a rapid, intuitive method for analyzing market dynamics without requiring complex manual calculations or extensive technical analysis.
When to explore it
This indicator is most effective in markets with significant price movement and when traders want to quickly assess recent price extremes. It works particularly well in volatile markets where understanding recent high and low points can provide critical insights into potential future price action.
Traders can utilize this tool across various timeframes and markets, from scalping to swing trading, to quickly identify key price levels and assess market volatility. It is especially useful during periods of market uncertainty, breakout attempts, or when evaluating potential trend reversals.
Keep exploring
What we’ve verified
Access, alerts and repainting behaviour have not been independently verified for this indicator. Check the creator’s current publication and settings.
General descriptions and classifications are recovered research. Verified details above identify the specific checks we have completed. Check the creator’s current publication for later changes.