YOUR INDICATOR RESEARCH STARTS HERE

Find the right indicator.
Understand what it does.

Explore 11,183 indicators. Filter beyond the obvious.
Discover the tools that fit the way you trade.

THE INDICATOR LIBRARY

Results for “limit”

11,183 tools to explore

67 indicators matching your filters
Save search
TrendVolatilityEditor’s pick

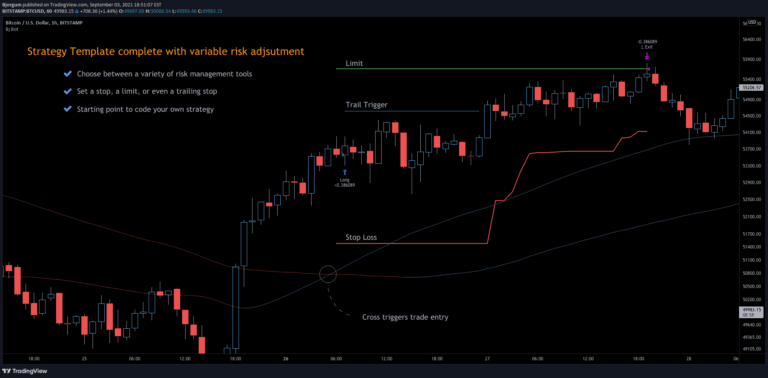
3Commas Bot

by Bjorgum

A 3Commas TradingView bot strategy offering automated trading with risk management, using moving average crossovers and customizable stop-loss and limit order settings.

Main price chart · unverifiedDay Trading · Swing Trading
Explore
12.2Klikes236.9Kviews187comments
Save
LevelsSignalVolume

Liquidity Pools [LuxAlgo]

by LuxAlgo

A dynamic indicator that identifies potential liquidity pools by tracking price interactions with specific zones, helping traders anticipate market movements and institutional trading strategies.

Main price chart · unverifiedScalping · Day Trading
Explore
8.8Klikes139.2Kviews8comments
Save
TrendVolatilityEditor’s pick

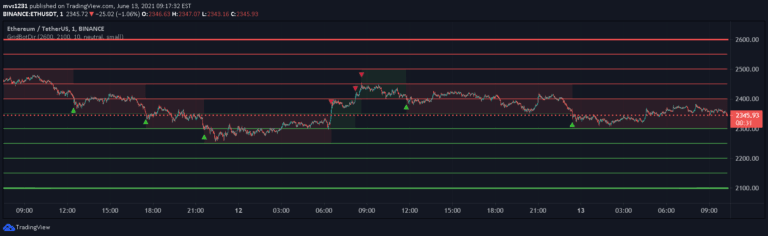
Grid Bot Simulator

by xxattaxx

A grid trading bot simulator that divides price ranges into zones, generating trading signals based on price movement in ranging and trending markets with customizable grid settings.

Main price chart · unverifiedDay Trading · Swing Trading
Explore
5Klikes105.4Kviews87comments
Save
SignalTrendVolatility

[EmreKb] Supertrend Fakeout

by EmreKb

An advanced Supertrend indicator that uses ATR and fakeout detection to identify more reliable trend reversals by minimizing false signals through additional price action verification.

Main price chart · unverifiedScalping · Day Trading
Explore
2.2Klikes29.5Kviews15comments
Save
SignalVolume

OrderFlow Absorption Indicator

by nico-von

An indicator that identifies price absorption points by tracking volume accumulation at specific levels, revealing potential market sentiment shifts and liquidity zones.

Main price chart · unverifiedScalping · Day Trading
Explore
1.1Klikes30.6Kviews9comments
Save
TrendMomentumEditor’s pick

RSI Bar Chart

by fikira

A multi-RSI plotting technique that allows customization of five different RSI indicators with varying parameters like source, length, timeframe, color, and visual representation.

Separate pane · unverifiedDay Trading · Swing Trading
Explore
927likes30.5Kviews34comments
Save
SignalVolatility

Limit Order + ATR Stop-Loss [TANHEF]

by TanHef

An interactive trading indicator that allows limit or stop-limit order placement with a trailing ATR stop-loss and optional profit target, offering dynamic risk management across different trade types.

Main price chart · unverifiedScalping · Day Trading
Explore
904likes27.8Kviews25comments
Save
TrendSignal

Bitcoin Limited Growth Model

by EliCobra

An advanced Bitcoin price prediction model using Stock-to-Flow ratio with nonlinear analysis, offering refined insights into cryptocurrency market dynamics and potential price movements.

Separate pane · unverifiedSwing Trading
Explore
737likes8.8Kviews2comments
Save
TrendMomentumEditor’s pick

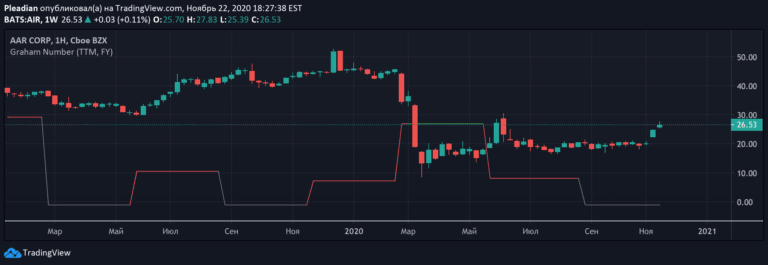
Graham Number

by Pleadian

Graham Number is a stock valuation metric that calculates a stock's maximum fair market value by considering earnings per share and book value per share using a specific formula.

Separate pane · unverifiedSwing Trading
Explore
598likes15Kviews9comments
Save
VolumeSignalLevels

Volume Gaps and Imbalances

by outofoptions

A Pine script indicator that identifies price inefficiencies through Volume Gaps and Imbalances, highlighting potential liquidity zones where price may seek rebalancing and future movement.

Main price chart · unverifiedScalping · Day Trading
Explore
576likes10.8Kviews7comments
Save

Likes, views, and comments are historical TradingView snapshots. They describe attention, not trading performance.

START WITH A QUESTION

A little less searching.
A lot more understanding.

Tell DeepAlpha what you need. Get an explanation, a shortlist,
and a direct path to the indicators behind it.

Ask DeepAlpha