Economic Calendar Events: FOMC, CPI, and more
A trading tool that tracks major economic events and their potential market impact, helping traders understand pivotal moments in financial markets.
Explore 11,183 indicators. Filter beyond the obvious.
Discover the tools that fit the way you trade.
11,183 tools to explore
A trading tool that tracks major economic events and their potential market impact, helping traders understand pivotal moments in financial markets.
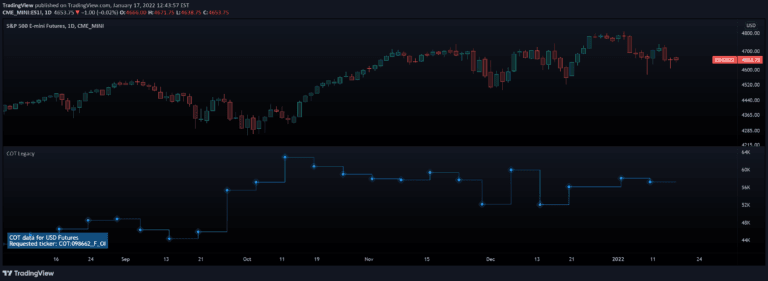
Commitment of Traders (COT) indicator provides insights into futures market positions by tracking open interest, trader classifications, and market participation across different exchanges.
An advanced trading concept that identifies overnight price gaps in futures markets, using specific time frames and standard deviation projections to analyze potential market movements and liquidity zones.
A trading tool that plots daily, weekly, and monthly settlement prices for futures, providing potential support/resistance levels and entry/exit points for traders.
CME futures price limit breaker tool that tracks price movement variations and identifies potential trading restrictions based on percentage changes during market sessions.
A dynamic trend channel indicator that identifies pivot points and creates Fibonacci-based channels to help traders visualize potential price movement and support/resistance zones.
A comprehensive indicator that autogenerates multiple trading levels and gaps across daily, weekly, and monthly timeframes, providing traders with key market insights and potential entry/exit points.
CME Bitcoin Futures gap identification tool that tracks price disparities during market closures, helping traders recognize potential price reversion opportunities.
A specialized trading tool that identifies and visualizes price gaps in cryptocurrency markets, focusing on weekend trading sessions and potential price movements.
A comprehensive trading indicator that generates dynamic pivot points, support and resistance lines, trend channels, and RSI divergences across multiple markets and timeframes.
CME Price Limit indicator highlighting trading boundaries based on previous daily settlement prices. Helps traders identify potential rule violations in futures prop firm accounts.
CME Price Limit calculates daily price thresholds for futures contracts using previous day's settlement price. It helps traders identify potential trading boundaries and manage risk during market volatility.
Likes, views, and comments are historical TradingView snapshots. They describe attention, not trading performance.