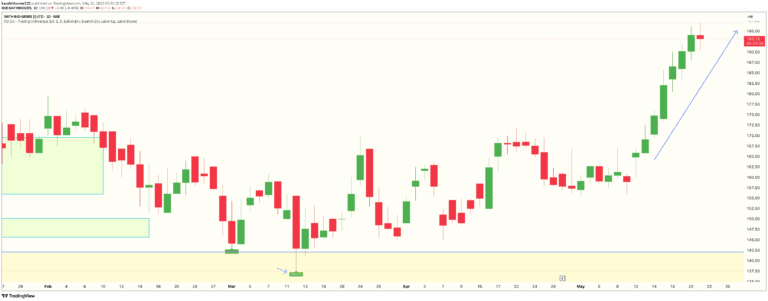
A trading indicator that combines CCI/Momentum and RSI to identify potential market reversals by detecting extreme price points and momentum shifts.
Explore complementary indicator rolesHow it works
The indicator analyzes price momentum by examining CCI/Momentum and RSI indicators to detect potential market reversals. It tracks when price reaches overbought or oversold conditions and looks for specific momentum signal changes that suggest a potential trend reversal.
By combining multiple technical analysis tools, the indicator generates buy and sell signals based on complex calculations. It checks for regular bullish and bearish divergences within RSI, calculates specific entry conditions, and plots visual signals on the chart to help traders identify potential trading opportunities.
Why it may be useful
The indicator provides traders with a comprehensive approach to identifying potential market turning points by integrating multiple technical analysis tools. It helps traders avoid getting trapped in the middle of a trend and offers insights into potential price reversals by using advanced momentum and oscillator calculations.
By offering visual signals and optional mean reversion bands, the indicator assists traders in making more informed trading decisions. It combines different technical indicators to improve the probability of identifying accurate entry and exit points, which can help traders enhance their overall trading strategy.
When to explore it
The indicator works best in markets with clear momentum shifts and identifiable trend reversals. It is particularly effective in volatile markets where price can quickly move between overbought and oversold conditions, making it suitable for traders who want to capture short to medium-term price movements.
Traders should use this indicator in conjunction with other technical and fundamental analysis tools to confirm signals. It is most effective when applied to liquid markets with sufficient price action, such as major forex pairs, stock indices, and actively traded commodities.
Keep exploring
What we’ve verified
Access, alerts and repainting behaviour have not been independently verified for this indicator. Check the creator’s current publication and settings.
General descriptions and classifications are recovered research. Verified details above identify the specific checks we have completed. Check the creator’s current publication for later changes.