Trendline Breakouts With Targets [ChartPrime]
An advanced trading indicator that identifies trendline breakouts and breakdowns, providing precise entry signals, target calculations, and visual trade management tools.
Explore 11,183 indicators. Filter beyond the obvious.
Discover the tools that fit the way you trade.
11,183 tools to explore
An advanced trading indicator that identifies trendline breakouts and breakdowns, providing precise entry signals, target calculations, and visual trade management tools.
A trading indicator that identifies unique price patterns using Fair Value Gaps and Breaker Blocks, highlighting potential entry and exit points with risk/reward targets.
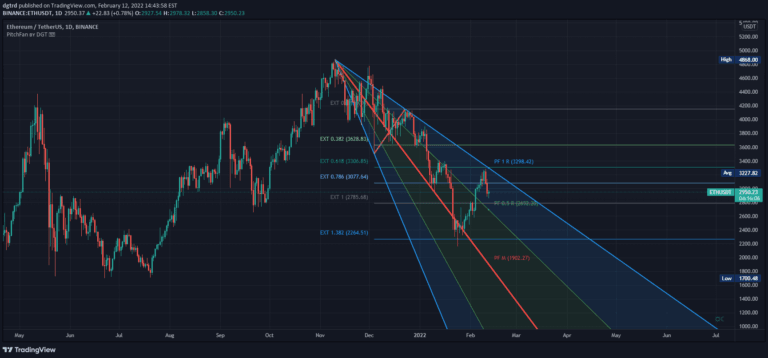
An advanced trading tool combining PitchFan, Fibonacci Extensions/Retracements, and ZigZag to identify potential support, resistance levels, and trend continuation signals.
A customizable moving average indicator that combines trend analysis with mean reversion detection, offering dynamic candle coloring and an oscillator to identify potential price shifts.
A trading signal that combines trend bias, oscillator analysis, and divergence detection to help traders make more informed decisions about trend continuation, reversal, and potential profit-taking.
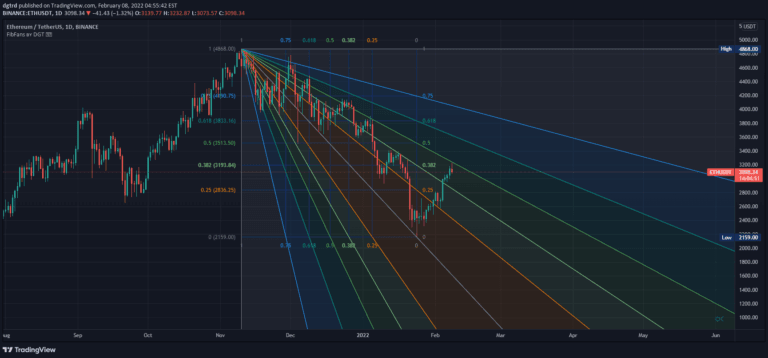
Fibonacci Speed and Resistance Fan is an analytical tool that identifies potential support and resistance levels by drawing lines based on Fibonacci percentages to predict trend changes and market movements.
A sentiment oscillator that measures bullish and bearish market sentiment by analyzing price movements across multiple bars to provide trend and entry/exit signals.
A multi-level moving average strategy that identifies trend strength by analyzing recursive moving averages across multiple levels, providing insights into market trend direction and potential reversals.
A trend-following indicator that analyzes moving averages through a channel method, measuring trend strength by comparing channel widths and providing visual cues about market direction.
Peak Activity Levels indicator identifies support and resistance zones using volume peaks, displaying price levels where significant trading activity occurs and highlighting potential market turning points.
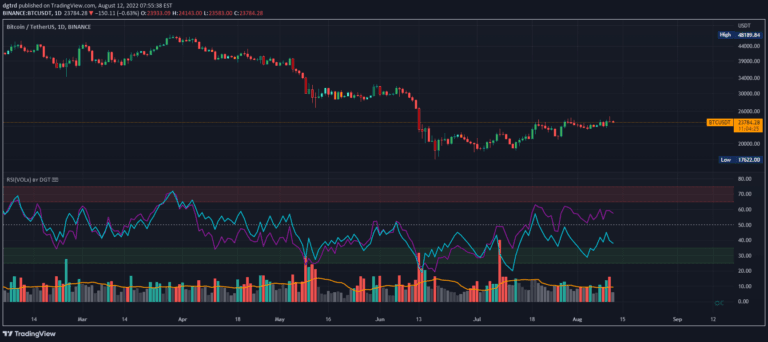
RSI is a momentum oscillator measuring price movement speed, analyzing price changes and volume to identify potential trend reversals and market conditions.
A trading signal that finds the most similar historical price sequences and projects future price movements using multiple similarity and correlation measures.
Likes, views, and comments are historical TradingView snapshots. They describe attention, not trading performance.