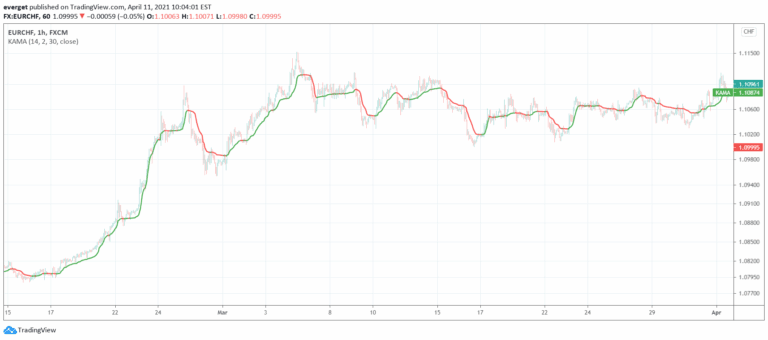
A trend-following indicator that analyzes moving averages through a channel method, measuring trend strength by comparing channel widths and providing visual cues about market direction.
Explore complementary indicator rolesHow it works
The indicator creates a channel using the highest and lowest points of a moving average over the last 300 bars. It calculates the width of the moving average channel relative to the overall price channel to determine trend existence. When the MA channel width exceeds a certain percentage of the price channel, it confirms a trend.
The indicator then assesses the relationship between the MA channel and price channel to evaluate trend strength. The moving average line's color intensity changes dynamically to reflect the trend's strength, providing a visual representation of market momentum
Why it may be useful
This indicator helps traders quickly identify and assess market trends by transforming complex price movements into a visually intuitive format. By analyzing moving average channels, traders can gain insights into trend strength and potential market direction.
The color-coded visualization allows for rapid trend recognition, reducing the cognitive load of interpreting multiple technical indicators. It provides a systematic approach to trend identification that can be applied across different markets and timeframes, enhancing traders' decision-making capabilities
When to explore it
The indicator works best in markets with clear directional movements and during periods of sustained trends. It is particularly useful for swing and day traders seeking to identify and confirm trend strength.
Traders should apply this tool in liquid markets with sufficient price action, such as major stock indices, forex pairs, and actively traded commodities. It is most effective when combined with other trend confirmation tools and during stable market conditions. Avoid using it during extreme market volatility or choppy, range-bound markets
Keep exploring
What we’ve verified
Access, alerts and repainting behaviour have not been independently verified for this indicator. Check the creator’s current publication and settings.
General descriptions and classifications are recovered research. Verified details above identify the specific checks we have completed. Check the creator’s current publication for later changes.