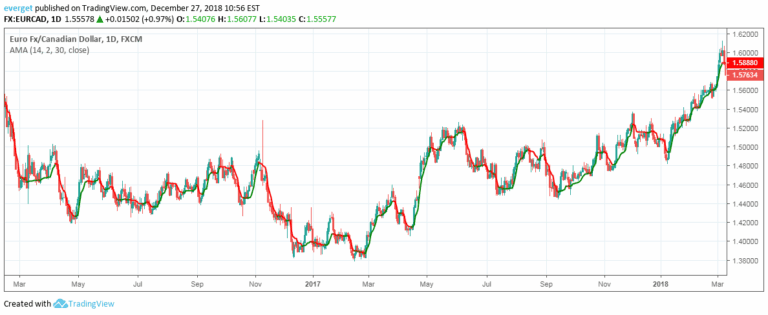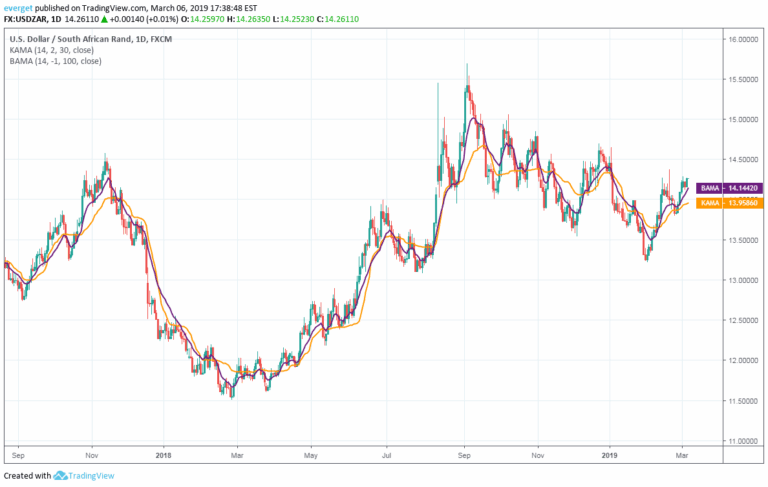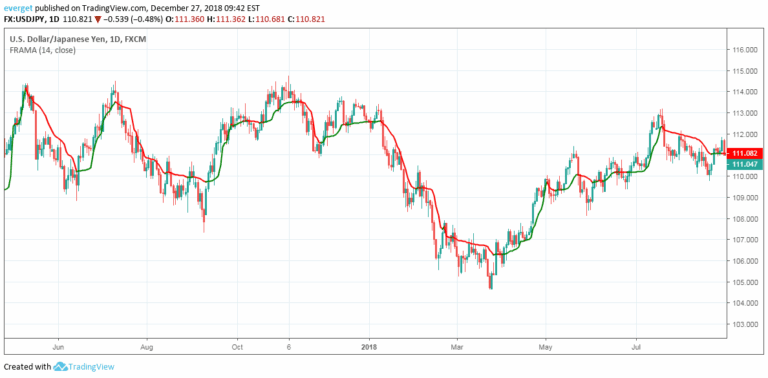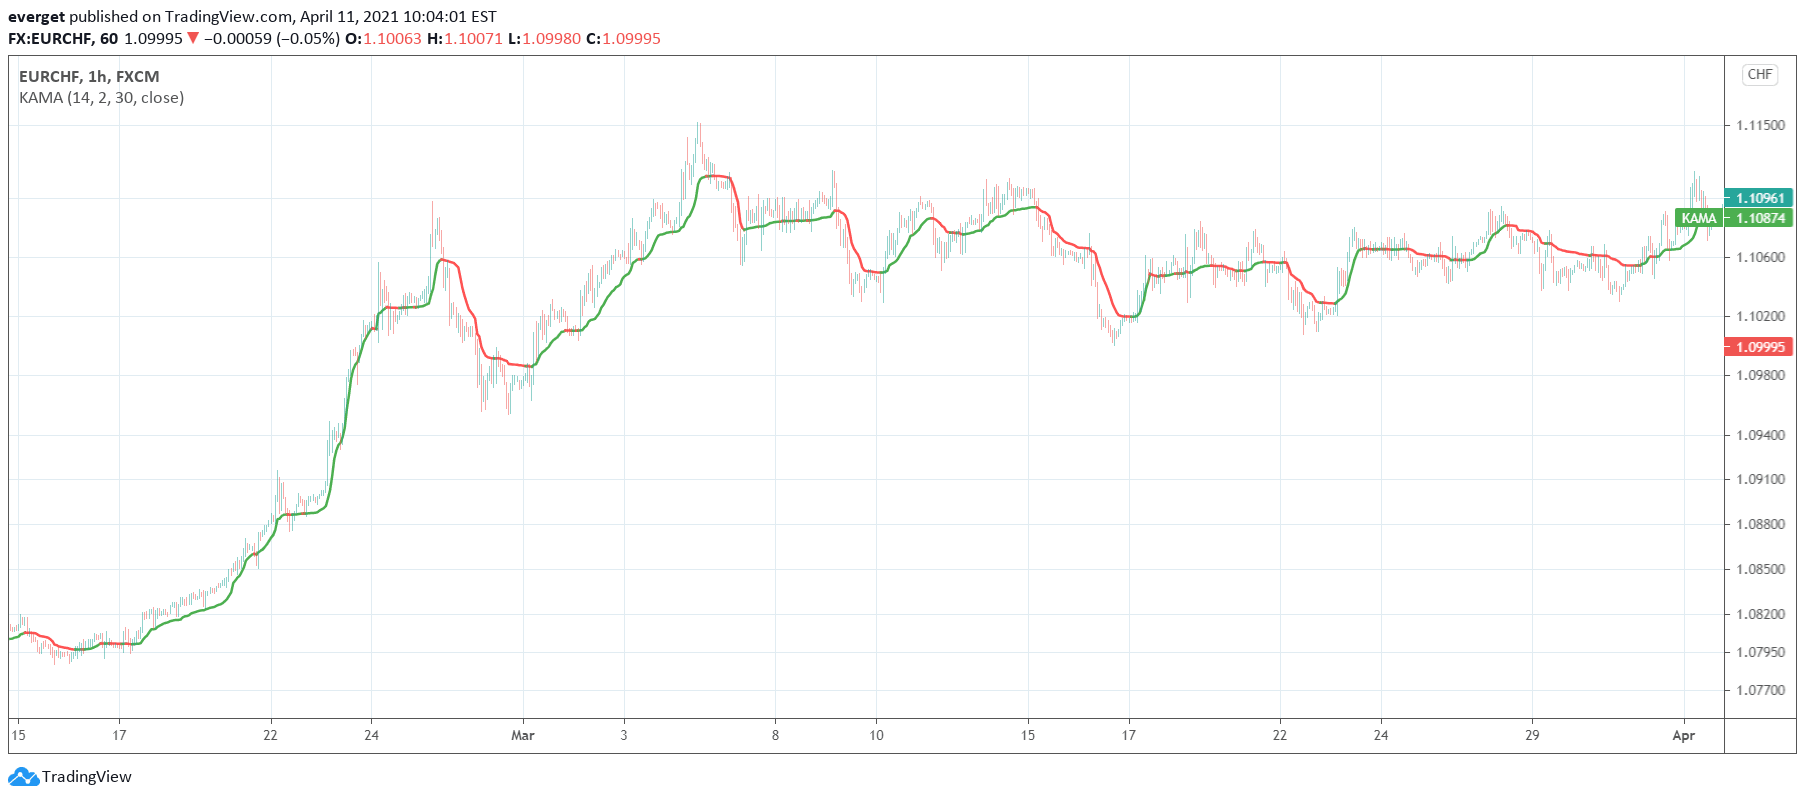
Kaufman Adaptive Moving Average is a dynamic indicator that adjusts its sensitivity based on market conditions, helping traders identify trend direction and momentum with improved responsiveness.
Explore complementary indicator rolesHow it works
The Kaufman Adaptive Moving Average (KAMA) calculates a moving average that dynamically adapts to market volatility and price changes. It uses an efficiency ratio that measures the trend's smoothness, allowing the indicator to quickly respond to significant price movements while filtering out minor market noise.
When price moves consistently in one direction, KAMA becomes more responsive, and when price fluctuates erratically, it becomes smoother. The calculation involves comparing current price to previous prices and determining the indicator's sensitivity based on market efficiency. This adaptive approach helps traders track price trends more effectively than traditional moving averages
Why it may be useful
KAMA is valuable because it addresses the limitations of traditional moving averages by adjusting to market conditions in real-time. Unlike fixed moving averages that can lag during volatile markets, KAMA provides more accurate trend signals by changing its sensitivity.
It helps traders distinguish between meaningful price movements and random market noise, reducing false signals. The indicator can improve trade entry and exit timing by offering a more responsive trend analysis. Traders can use KAMA to identify trend direction, potential trend reversals, and support/resistance levels with greater precision
When to explore it
KAMA works best in markets with clear trending characteristics and moderate volatility. It is particularly effective in identifying trend strength and potential trend changes across different financial instruments like stocks, forex, and commodities.
Traders should use KAMA in conjunction with other technical indicators to confirm signals and reduce false positives. It performs well in markets experiencing sustained directional moves and can help filter out short-term market fluctuations. KAMA is most reliable when used on daily, weekly, and intraday charts with moderate price movements
Keep exploring
What we’ve verified
Access, alerts and repainting behaviour have not been independently verified for this indicator. Check the creator’s current publication and settings.
General descriptions and classifications are recovered research. Verified details above identify the specific checks we have completed. Check the creator’s current publication for later changes.