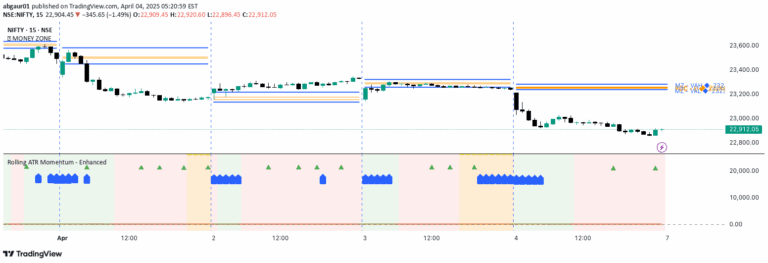
A dual-purpose indicator combining momentum and volatility analysis to provide comprehensive market insights across multiple timeframes and asset classes.
Explore complementary indicator rolesHow it works
The indicator calculates momentum by measuring the price difference over 80 periods, displaying this as a semi-transparent filled area that visually represents price movement dynamics. This longer-term momentum perspective helps traders understand the underlying trend strength and directional price changes.
Simultaneously, the Average True Range (ATR) is computed over 14 periods and plotted as a fine orange line, quantifying market volatility. By tracking both momentum and volatility in one panel, traders gain a more nuanced understanding of market conditions, with the momentum area showing trend direction and the ATR line indicating potential price fluctuation intensity.
Why it may be useful
This indicator provides traders with a comprehensive view of market behavior by integrating two critical analytical perspectives: momentum and volatility. By visualizing how price changes and market volatility interact, traders can make more informed decisions about potential entry and exit points across different financial instruments.
The combined approach allows for a more holistic market assessment, reducing the likelihood of misinterpreting price movements by considering both directional strength and potential price fluctuation ranges. This dual-perspective analysis can help traders identify more robust trading opportunities and manage risk more effectively.
When to explore it
The indicator is most effective during trending market conditions where clear momentum and volatility patterns emerge. Traders can use it to confirm trend strength, identify potential reversals, and assess the reliability of price movements across stocks, forex, and cryptocurrency markets.
It is particularly valuable when transitioning between market states, such as from a consolidation phase to a trending environment. By providing insights into both price momentum and volatility, the indicator helps traders adapt their strategies to changing market dynamics and make more precision-driven trading decisions.
Keep exploring
What we’ve verified
Access, alerts and repainting behaviour have not been independently verified for this indicator. Check the creator’s current publication and settings.
General descriptions and classifications are recovered research. Verified details above identify the specific checks we have completed. Check the creator’s current publication for later changes.