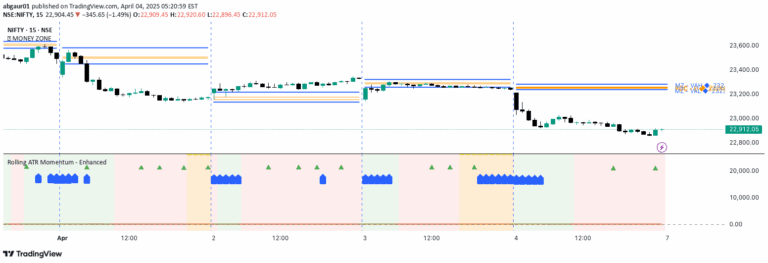
The Rolling ATR Momentum Indicator tracks market volatility by comparing current and past Average True Range (ATR) values. It helps traders identify momentum shifts and potential trading opportunities.
Explore complementary indicator rolesHow it works
The indicator calculates the difference between the current Average True Range (ATR) and a past ATR value over a specified period. It plots this delta as a line that moves above and below a zero line, with green indicating increasing volatility and red showing decreasing volatility.
The calculation uses two primary parameters: the ATR period (default 14) and a lookback period (default 5). When the delta is positive, it suggests rising market energy, while a negative delta indicates declining market momentum
Why it may be useful
Traders need to understand market volatility to make informed decisions, and this indicator provides a clear visual representation of momentum changes. It helps filter out low-volatility market conditions and identifies potential entry and exit points.
By measuring the rate of volatility change, traders can avoid trading during stagnant market periods and focus on times of increased market activity. The indicator offers a simple yet powerful way to gauge market energy and potential trading opportunities
When to explore it
The Rolling ATR Momentum Indicator works best in trending or breakout environments, particularly for index futures and options trading. It is most effective when combined with other trend or price structure tools like moving averages or candlestick patterns.
Traders should use it to confirm momentum, anticipate breakouts, and adjust stop-loss strategies. It is particularly useful for intraday and swing traders looking to capture significant market moves
Keep exploring
What we’ve verified
Access, alerts and repainting behaviour have not been independently verified for this indicator. Check the creator’s current publication and settings.
General descriptions and classifications are recovered research. Verified details above identify the specific checks we have completed. Check the creator’s current publication for later changes.