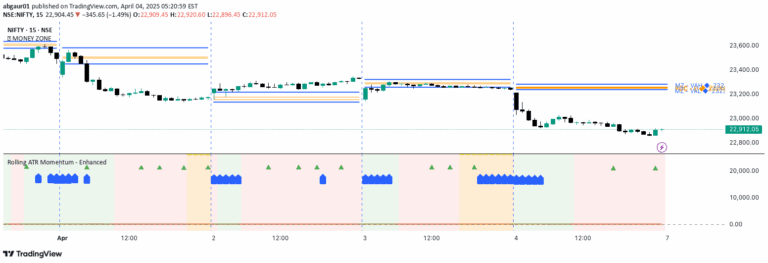
ATR Momentum is a technical analysis tool that assesses price movement momentum by comparing short-term and long-term Average True Range (ATR) values to indicate trend strength.
Explore complementary indicator rolesHow it works
The ATR Momentum indicator calculates two distinct Average True Range values: a faster short-term ATR and a slower long-term ATR. By comparing these two measurements, traders can visualize the dynamic momentum of a security's price movement.
When the short-term ATR exceeds the long-term ATR, it indicates increasing momentum, which is represented by a green fill between the lines. Conversely, when the short-term ATR falls below the long-term ATR, it suggests decreasing momentum, marked by a red fill between the lines.
Why it may be useful
The ATR Momentum indicator provides traders with a powerful visual representation of price movement dynamics, helping them understand the underlying strength and direction of market trends. By revealing momentum shifts, traders can make more informed decisions about potential entry and exit points.
This tool is particularly valuable because it combines volatility analysis with momentum assessment, offering a comprehensive view of market behavior. The color-coded visualization makes it easy for traders to quickly interpret market conditions and potential trend changes.
When to explore it
The ATR Momentum indicator is most effective in markets with clear trending characteristics, where price movements exhibit consistent directional momentum. It works particularly well in volatile markets where rapid changes in price momentum are common.
Traders should consider using this indicator during periods of significant market activity, such as during earnings announcements, economic reports, or when trading instruments known for their dynamic price movements. It is especially useful for identifying potential trend reversals and confirming the strength of existing market trends.
Keep exploring
What we’ve verified
Access, alerts and repainting behaviour have not been independently verified for this indicator. Check the creator’s current publication and settings.
General descriptions and classifications are recovered research. Verified details above identify the specific checks we have completed. Check the creator’s current publication for later changes.