YOUR INDICATOR RESEARCH STARTS HERE

Find the right indicator.
Understand what it does.

Explore 11,183 indicators. Filter beyond the obvious.
Discover the tools that fit the way you trade.

THE INDICATOR LIBRARY

Results for “diversification”

11,183 tools to explore

47 indicators matching your filters
Save search
VolumeTrendEditor’s pick

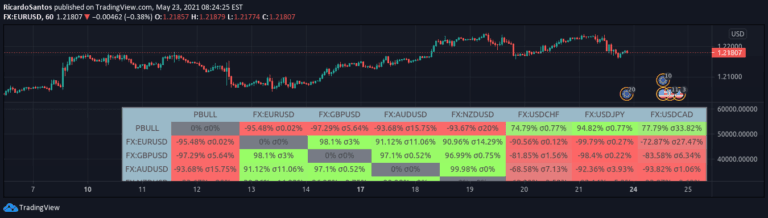
Correlation Matrix Heatmap

by RicardoSantos

A Correlation Matrix utilizes statistical tables to analyze relationships between different financial variables, helping traders understand interconnected market behaviors and potential predictive patterns.

Separate pane · unverifiedSwing Trading
Explore
854likes31.4Kviews13comments
Save
IncomeSignalEditor’s pick

Dividend Calendar (Zeiierman)

by Zeiierman

A comprehensive dividend tracking tool that helps investors analyze dividend payouts, forecast income, and make strategic investment decisions across various stocks and sectors.

Separate pane · unverifiedDay Trading · Swing Trading
Explore
625likes47.8Kviews22comments
Save
TrendVolatilityEditor’s pick

Correlation Heatmap

by TradingView

A correlation matrix indicator that calculates Pearson correlation coefficients between multiple financial instruments, revealing how different assets' returns move in relation to each other.

Separate pane · unverifiedSwing Trading
Explore
622likes22.8Kviews10comments
Save
TrendVolatilityEditor’s pick

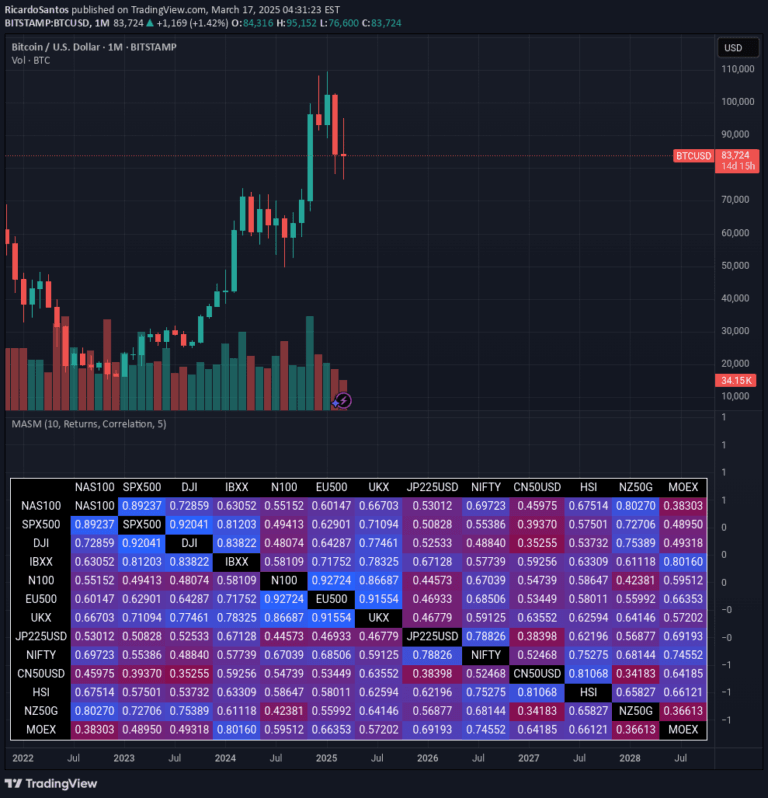
Multi Asset Similarity Matrix

by RicardoSantos

A market analysis tool that calculates and visualizes asset similarities using advanced mathematical measures, revealing complex relationships between different market indices through color-coded correlation metrics.

Separate pane · unverifiedDay Trading · Swing Trading
Explore
459likes21.7Kviews5comments
Save
TrendVolatilityEditor’s pick

Modern Portfolio Management Indicator

by Steversteves

A portfolio analysis tool based on Modern Portfolio Theory that helps investors evaluate and simulate potential investment strategies by comparing multiple stocks' historical performance and risk characteristics.

Separate pane · unverifiedSwing Trading
Explore
310likes33.3Kviews13comments
Save
SignalTrend

Correlation Tracker

by Julien_Eche

Correlation Tracker analyzes the relationship between two trading symbols, calculating their correlation strength and providing visual insights into their price movement interactions.

Separate pane · unverifiedScalping · Day Trading
Explore
299likes6.1Kviews6comments
Save
SignalTrend

Correlation Crypto Matrix

by VanHe1sing

A correlation matrix tool that reveals linear relationships between different cryptocurrency trading symbols, helping traders understand market interconnectedness and potential trading opportunities.

Separate pane · unverifiedDay Trading · Swing Trading
Explore
214likes4.2Kviews2comments
Save
Trend

Pearson Correlation [Mr_Rakun]

by Mr_Rakun

Pearson Correlation measures the statistical relationship between two assets' price movements, helping traders understand how different markets interact and potentially move together or inversely.

Separate pane · unverifiedSwing Trading
Explore
127likes1.5Kviews0comments
Save
SignalLevels

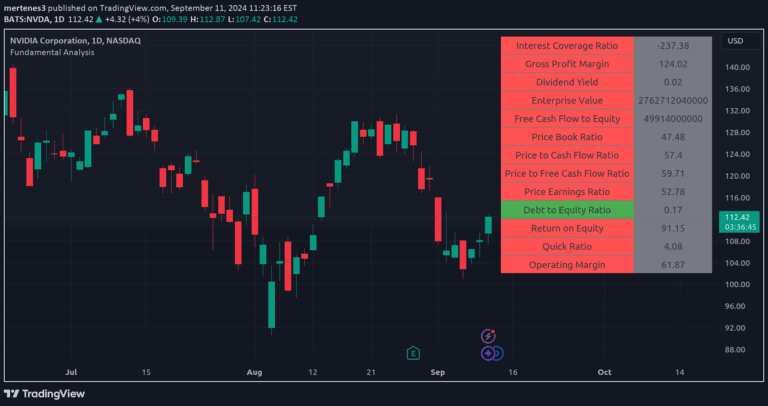
Fundamental Analysis

by mertenes3

A comprehensive financial metrics indicator that provides quick, color-coded insights into a company's financial health through multiple essential ratios and performance indicators.

Separate pane · unverifiedSwing Trading
Explore
96likes2.1Kviews0comments
Save

Likes, views, and comments are historical TradingView snapshots. They describe attention, not trading performance.

START WITH A QUESTION

A little less searching.
A lot more understanding.

Tell DeepAlpha what you need. Get an explanation, a shortlist,
and a direct path to the indicators behind it.

Ask DeepAlpha