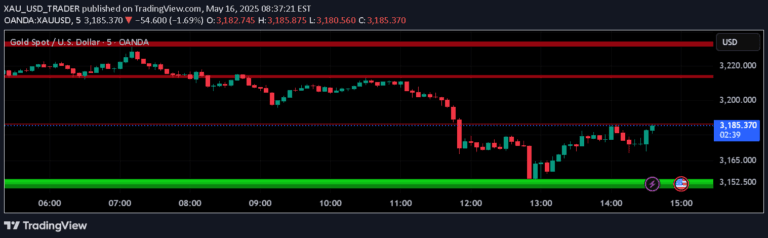
A dynamic support and resistance indicator using RSI that identifies key price levels based on overbought and oversold conditions across multiple lookback periods.
Explore complementary indicator rolesHow it works
The indicator generates support and resistance levels by analyzing RSI values across five different lookback periods. It identifies the highest and lowest pivots within each period and compares them against current RSI readings and overbought/oversold thresholds.
When the RSI exceeds the highest pivot or falls below the lowest pivot and meets overbought or oversold conditions, specific high and low levels are assigned. These levels are calculated dynamically, providing adaptive support and resistance zones that respond to current market momentum and price action.
Why it may be useful
Traders benefit from this indicator's ability to dynamically map key price levels using momentum analysis. By integrating RSI's overbought and oversold signals with pivot-based support and resistance, it offers a more nuanced view of potential market turning points.
The multi-period approach allows traders to identify critical price zones across different timeframes, enhancing decision-making by providing a comprehensive perspective on market trends and potential reversal points.
When to explore it
This indicator is most effective in markets with clear momentum and well-defined trend cycles. It works best in volatile markets where price movements are significant enough to generate meaningful RSI signals and pivot points.
Traders should apply this tool in timeframes ranging from 5 to 30 minutes, particularly during active trading sessions with consistent price movements. It is especially useful for identifying potential entry and exit points in trending and ranging markets.
Keep exploring
What we’ve verified
Access, alerts and repainting behaviour have not been independently verified for this indicator. Check the creator’s current publication and settings.
General descriptions and classifications are recovered research. Verified details above identify the specific checks we have completed. Check the creator’s current publication for later changes.