2B Reversal Pattern (Expo)
The 2B reversal pattern identifies potential market trend reversals by detecting false breakouts and price rebounds, signaling opportune entry points for traders.
Explore 11,183 indicators. Filter beyond the obvious.
Discover the tools that fit the way you trade.
11,183 tools to explore
The 2B reversal pattern identifies potential market trend reversals by detecting false breakouts and price rebounds, signaling opportune entry points for traders.
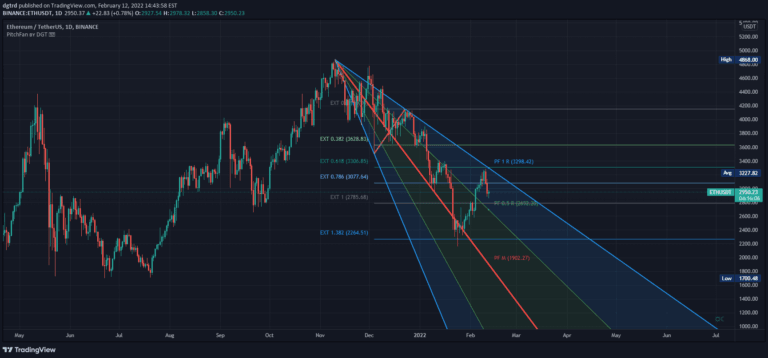
An advanced trading tool combining PitchFan, Fibonacci Extensions/Retracements, and ZigZag to identify potential support, resistance levels, and trend continuation signals.
HyperTrend is a real-time trend estimation indicator that constructs support and resistance channels to help traders identify market direction and potential trading opportunities.
A comprehensive trading indicator combining Parabolic SAR, EMA 200, and MACD to generate precise buy and sell signals by analyzing market trends and momentum.
A versatile trading tool that generates price targets based on multiple technical indicators, helping traders set profit levels and manage risk dynamically.
A dynamic support/resistance indicator that classifies strength levels from 1-10 using higher time-frame data, helping traders identify key price zones across different timeframes.
A comprehensive volume analysis tool that examines trading volume dynamics, measuring market participation, interest, and potential price movement signals through multiple volume-based indicators.
A trading indicator that calculates average Fair Value Gap (FVG) initiation levels to identify potential support and resistance zones based on significant market participant positioning.
A comprehensive market structure indicator that highlights key support and resistance levels, tracks price interactions, and provides volume insights to help traders understand market dynamics.
A trading tool that identifies support and resistance retests, marking potential entry points by analyzing price action around key market levels with customizable detection methods.
A dynamic support and resistance level indicator that scores potential trading zones based on volume, bounce frequency, and price interactions, providing visual insights into market structure.
A sophisticated logistic regression indicator that identifies and predicts support and resistance levels using advanced statistical modeling and market condition analysis.
Likes, views, and comments are historical TradingView snapshots. They describe attention, not trading performance.