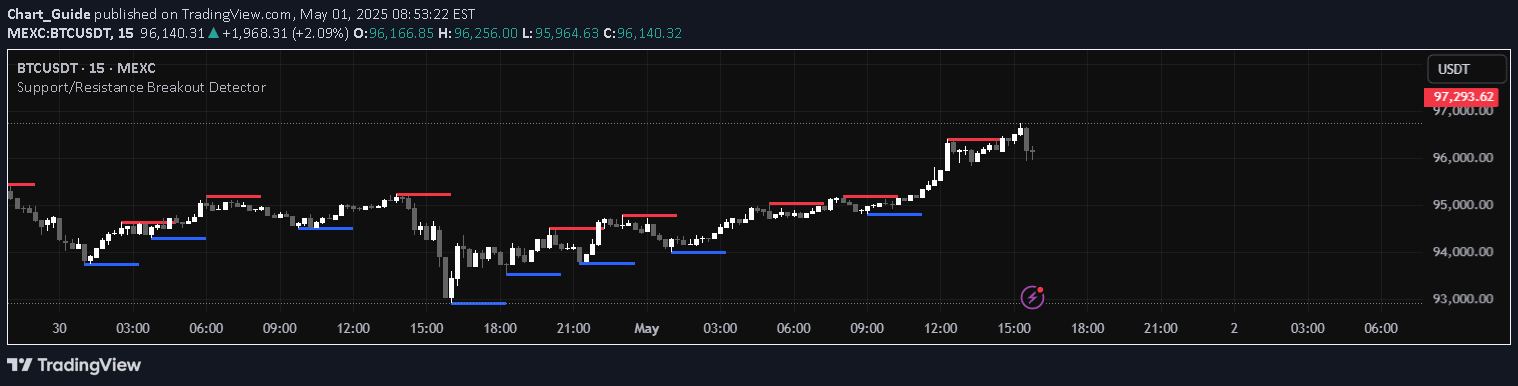
A trading tool that identifies support and resistance retests, marking potential entry points by analyzing price action around key market levels with customizable detection methods.
Explore complementary indicator rolesHow it works
The Retest Support Resistance Signals Indicator analyzes price action around key market levels by detecting pivot points through customizable detection methods using either wicks or bodies. It identifies support and resistance levels and monitors for potential retests, marking these moments with an 'R' label when specific conditions are met.
The indicator waits for a break above a support or resistance level and then observes subsequent price action. When price retraces and forms a specific wick pattern followed by a bounce, the indicator confirms a retest, providing traders with visual signals about potential level confirmation or weakness.
Why it may be useful
This indicator provides traders with a nuanced understanding of market structure by offering insights into the strength and reliability of support and resistance levels. By identifying retests, traders can gain valuable information about potential trend continuations or reversals, helping them make more informed trading decisions.
The versatility of the indicator allows traders to adapt to different market philosophies, whether they believe levels get weaker or stronger with repeated tests. This flexibility makes it a powerful tool for understanding market dynamics and potential entry or exit points across various trading strategies.
When to explore it
The Retest Support Resistance Signals Indicator is most effective in markets with clear directional movements and well-defined support and resistance levels. It works particularly well in trending markets where price consistently respects key structural levels and demonstrates predictable retest behaviors.
Traders should use this indicator in conjunction with other technical analysis tools and not rely on it as a standalone signal. It is especially useful for traders who focus on support and resistance trading strategies, want to confirm potential entry points, and need a visual representation of market structure.
Keep exploring
What we’ve verified
Access, alerts and repainting behaviour have not been independently verified for this indicator. Check the creator’s current publication and settings.
General descriptions and classifications are recovered research. Verified details above identify the specific checks we have completed. Check the creator’s current publication for later changes.