
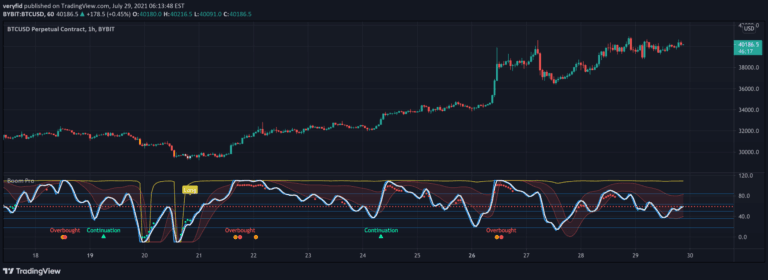
Boom Hunter Pro
Boom Hunter Pro is an advanced trading indicator using Ehlers Early Onset Trend oscillator to identify potential long entries and short opportunities across different timeframes.
Explore 11,183 indicators. Filter beyond the obvious.
Discover the tools that fit the way you trade.
11,183 tools to explore
Boom Hunter Pro is an advanced trading indicator using Ehlers Early Onset Trend oscillator to identify potential long entries and short opportunities across different timeframes.
A trading indicator designed to identify market liquidity zones and potential reversal areas by analyzing candle structures, wick-to-body ratios, and market sentiment shifts.
A hybrid trading indicator combining Fibonacci retracement levels and RSI to identify potential market reversals and trading opportunities based on support, resistance, and momentum signals.
Profit Hunter is an advanced multi-strategy trading indicator combining T3 moving averages, trend strength analysis, and breakout detection to identify high-probability trading opportunities across different markets.
A multi-dimensional trading signal that identifies potential trend reversals and continuations using engulfing candle patterns, band lines, and color-coded visual indicators.
John Ehler's MESA Stochastic is a unique indicator using super smoothing to analyze market waves, help identify market tops and bottoms, and generate trading signals.
A trading indicator identifying market maker liquidity targets through multi-timeframe highs/lows and fair value gaps, helping traders predict potential price movements.
A multi-indicator trading strategy combining Supertrend, EMA, and RSI to generate buy and sell signals with customizable parameters and trend identification.
A trading exit signal that combines RSI and MACD to help traders identify optimal points to close long and short positions with dynamic volatility adjustments.
A dynamic moving average crossover strategy that uses volume confirmation and ATR-based filters to generate precise buy and sell trading signals across different markets.
A technical analysis tool that identifies price inefficiencies by detecting Fair Value Gaps, highlighting areas with little to no traded volume using color-coded boxes on the chart.
A market phase indicator that detects bullish and bearish engulfing reversal patterns, helping traders identify potential trend changes and filter trade entries based on market direction.
Likes, views, and comments are historical TradingView snapshots. They describe attention, not trading performance.
