Supply and Demand Visible Range [LuxAlgo]
A volume-based indicator that identifies supply and demand zones on a chart, revealing potential support and resistance levels using precise volume and price analysis.
Explore 11,183 indicators. Filter beyond the obvious.
Discover the tools that fit the way you trade.
11,183 tools to explore
A volume-based indicator that identifies supply and demand zones on a chart, revealing potential support and resistance levels using precise volume and price analysis.
A depth chart visualizing price liquidity by mapping bullish and bearish price variations, highlighting volume clusters and potential support/resistance zones across trading ranges.
Advanced machine learning trading tool using kernel regression to predict price targets and trends. Provides dynamic analysis with customizable settings for enhanced trading decision-making.
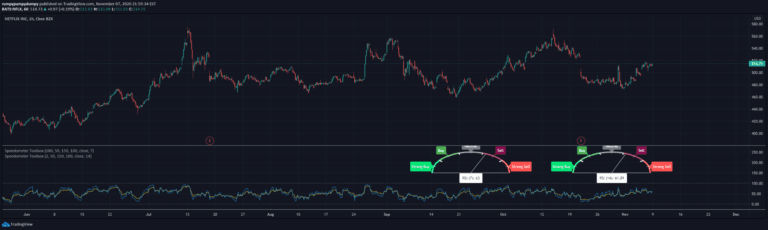
Custom metric speedometers provide specialized visualization techniques for tracking and representing performance indicators through graphical gauge-like representations.
A trading tool that plots global market sessions with volume and delta analytics, helping traders visualize institutional activity and key market structure zones.
An advanced Bitcoin price prediction model using Stock-to-Flow ratio with nonlinear analysis, offering refined insights into cryptocurrency market dynamics and potential price movements.
A volume indicator estimating buy and sell volumes through price bar analysis, revealing market dynamics and potential supply/demand shifts without direct volume data.
A comprehensive trading dashboard that aggregates critical company information, fundamental data, price metrics, and analyst ratings into a single, easy-to-view analytical tool.
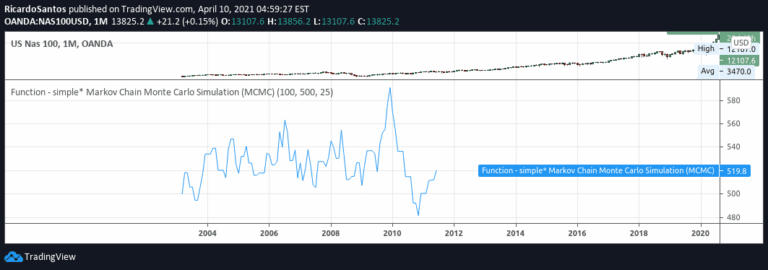
A Monte Carlo Markov Chain simulation is a computational technique used to model complex probabilistic systems and explore potential outcomes through random sampling and statistical analysis.
Advanced Heikin-Ashi RSI Oscillator that transforms RSI into candle representations, providing deep insights into market momentum, trend states, and potential reversals.
An advanced trading indicator that tracks multiple positions simultaneously, providing real-time portfolio analytics, risk management insights, and comprehensive visual performance tracking.
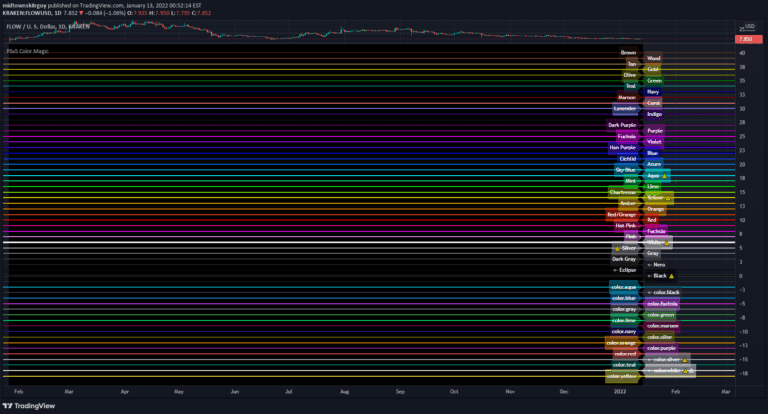
A Pine Script color visualization tool designed to enhance trading indicator development by leveraging advanced color manipulation techniques for improved data representation and visual analytics.
Likes, views, and comments are historical TradingView snapshots. They describe attention, not trading performance.