A Pine Script color visualization tool designed to enhance trading indicator development by leveraging advanced color manipulation techniques for improved data representation and visual analytics.
Explore complementary indicator rolesHow it works
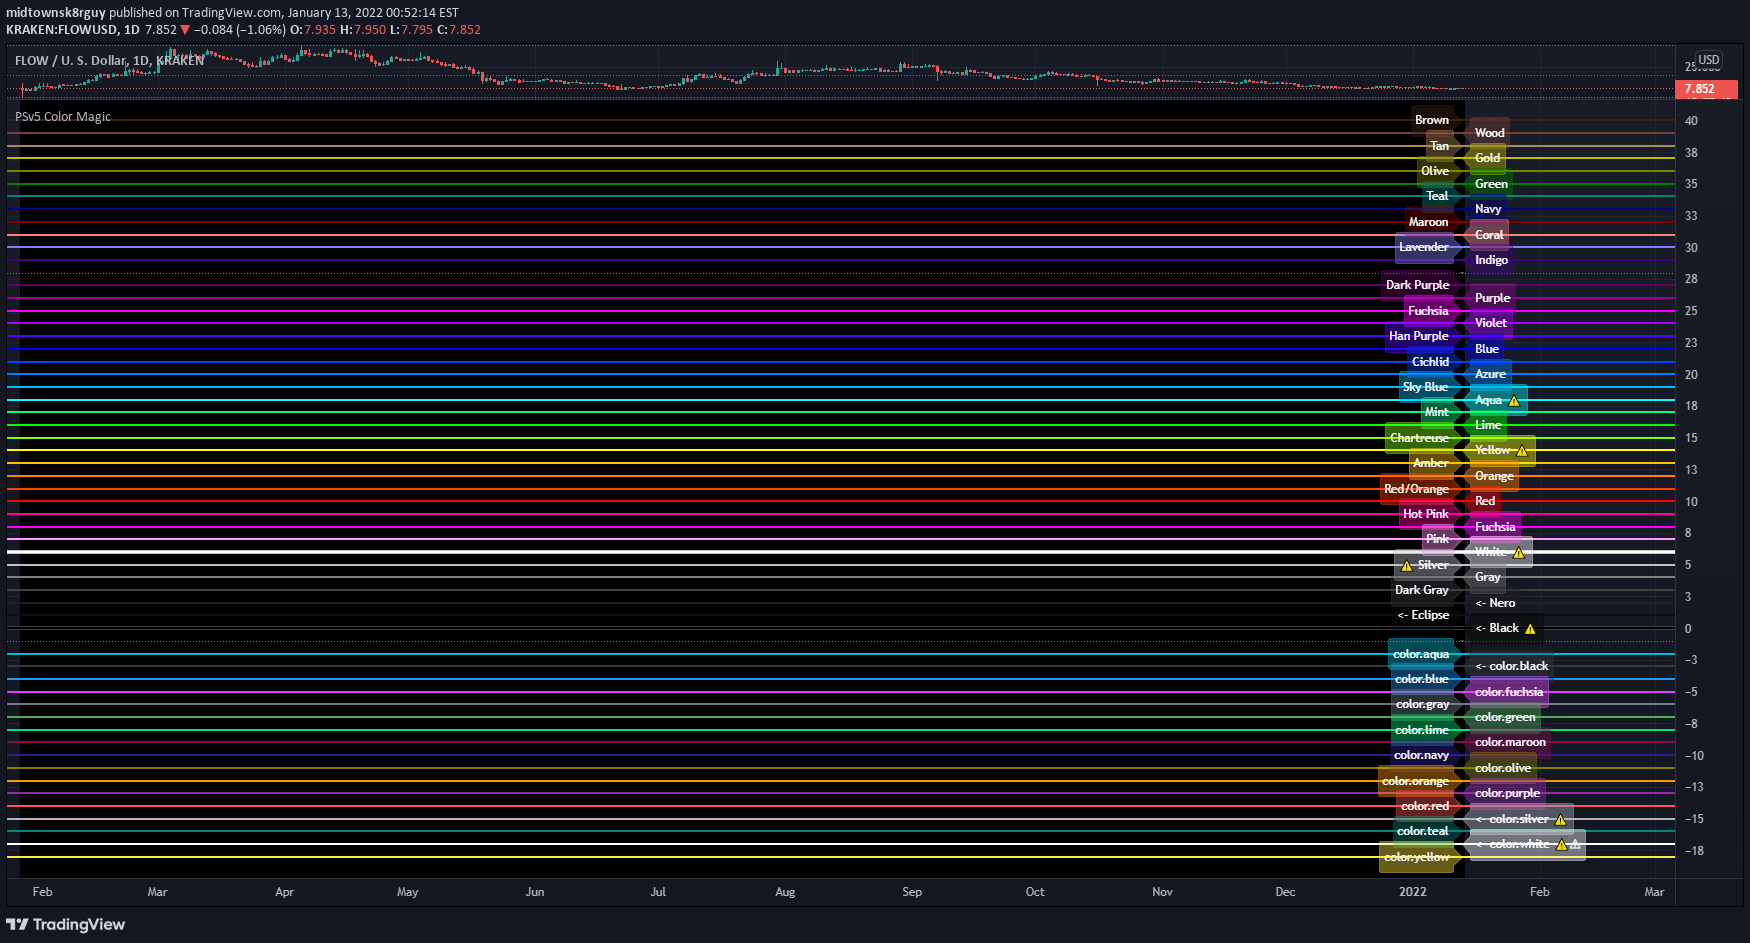
This color magic tool in Pine Script v5.0 transforms numeric data into visually compelling graphical representations using advanced color functions. It utilizes color.rgb(), color. from_gradient(), and other color manipulation techniques to convert raw numerical data into meaningful visual indicators.
By applying dynamic color transformations, the script converts complex numeric calculations into intuitive visual aids. The tool provides extensive color customization options, allowing traders to create highly personalized and informative chart displays. It supports multiple color generation methods, enabling precise visual communication of trading insights
Why it may be useful
Color visualization is crucial in trading analysis as it helps traders quickly interpret complex data patterns and numeric information. By transforming abstract numbers into visually engaging representations, traders can more rapidly identify trends, anomalies, and potential trading opportunities.
The tool empowers developers to create more intuitive and user-friendly indicators that communicate information more effectively. Enhanced visual communication reduces cognitive load and enables faster decision-making. Color-based indicators can reveal subtle market nuances that might be overlooked in traditional numeric presentations
When to explore it
This color visualization tool is most effective when developing custom trading indicators that require complex data representation. It works best for traders and developers seeking to create more intuitive and visually appealing chart analysis tools.
The tool is particularly useful when designing indicators that involve multiple data streams or require nuanced color-based interpretations. It can be applied across various trading styles, from short-term scalping to long-term investment strategies. Developers can leverage this tool to create more engaging and informative technical analysis indicators
Keep exploring
What we’ve verified
Access, alerts and repainting behaviour have not been independently verified for this indicator. Check the creator’s current publication and settings.
General descriptions and classifications are recovered research. Verified details above identify the specific checks we have completed. Check the creator’s current publication for later changes.