YOUR INDICATOR RESEARCH STARTS HERE

Find the right indicator.
Understand what it does.

Explore 11,183 indicators. Filter beyond the obvious.
Discover the tools that fit the way you trade.

THE INDICATOR LIBRARY

Results for “color”

11,183 tools to explore

2,570 indicators matching your filters
Save search
TrendMomentumEditor’s pick

Linear Regression Channel

by LonesomeTheBlue

A Linear Regression Channel indicator that tracks price trends, identifies channel breakouts, and analyzes momentum direction using dynamic visual signals and customizable settings.

Main price chart · unverifiedDay Trading · Swing Trading
Explore
13.8Klikes407.9Kviews126comments
Save
VolumeEditor’s pick

Volume Profile / Fixed Range

by LonesomeTheBlue

A Volume Profile indicator that calculates trading volumes within a fixed range, helping traders understand volume distribution and identifying key price levels with visual representation.

Main price chart · unverifiedDay Trading · Swing Trading
Explore
13.4Klikes576.6Kviews171comments
Save
TrendMomentumEditor’s pick

Linear Regression Oscillator [ChartPrime]

by ChartPrime

A custom indicator using linear regression to analyze closing prices, helping traders identify market trends, mean reversion, and potential overbought or oversold conditions across different timeframes.

Separate pane · unverifiedDay Trading · Swing Trading
Explore
10.5Klikes214.9Kviews76comments
Save
LevelsSignalVolatility

Range Detector [LuxAlgo]

by LuxAlgo

A dynamic range detection indicator that identifies price consolidation zones, highlights range extremities, and signals potential breakouts using real-time color-coded markers.

Main price chart · unverifiedScalping · Day Trading
Explore
9.4Klikes237Kviews62comments
Save
VolumeSignal

Volume Delta Candles [LuxAlgo]

by LuxAlgo

Volume Delta Candles analyze intrabar trading activity by comparing buy and sell volumes, providing visual insights into price movement and trading sentiment within each candle.

Main price chart · unverifiedScalping · Day Trading
Explore
8.8Klikes229.5Kviews53comments
Save
TrendEditor’s pick

[SK] Fibonacci Auto Trend Scouter

by sirkriz

FATS is an advanced trading indicator that automatically draws trend lines, Fibonacci levels, and trend sights across multiple timeframes to help traders identify market direction and potential support/resistance zones.

Main price chart · unverifiedDay Trading · Swing Trading
Explore
8.5Klikes249.7Kviews153comments
Save
TrendVolatilityEditor’s pick

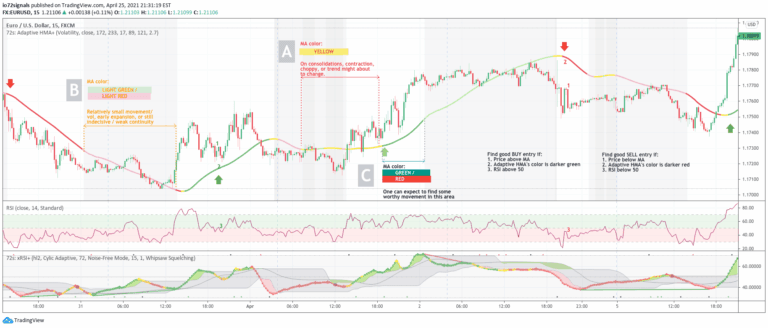
72s: Adaptive Hull Moving Average+

by io72signals

An adaptive Hull Moving Average that dynamically adjusts its period based on volume and volatility, providing clearer trend signals and market condition insights for traders.

Main price chart · unverifiedDay Trading · Swing Trading
Explore
8.2Klikes154.6Kviews137comments
Save
VolumeEditor’s pick

Heatmap Volume [xdecow]

by xdecow

A volume heat map indicator that colors volume bars and candles based on the standard deviation of trading volume from its average. Provides visual insights into volume intensity and potential market significance.

Separate pane · unverifiedDay Trading · Swing Trading
Explore
7.2Klikes214.2Kviews107comments
Save

Likes, views, and comments are historical TradingView snapshots. They describe attention, not trading performance.

START WITH A QUESTION

A little less searching.
A lot more understanding.

Tell DeepAlpha what you need. Get an explanation, a shortlist,
and a direct path to the indicators behind it.

Ask DeepAlpha