

YOUR INDICATOR RESEARCH STARTS HERE

Find the right indicator.
Understand what it does.

Explore 11,183 indicators. Filter beyond the obvious.
Discover the tools that fit the way you trade.

THE INDICATOR LIBRARY

Results for “plot”

11,183 tools to explore

244 indicators matching your filters
Save search
TrendSignalChannels

Linear Regression Channel

by ChartPrime

A comprehensive technical analysis tool that uses linear regression to plot channels, bands, and future price projections, helping traders identify trends, potential reversals, and market dynamics.

Main price chart · unverifiedScalping · Day Trading
Explore
7.2Klikes92.2Kviews29comments
Save
TrendMomentumEditor’s pick

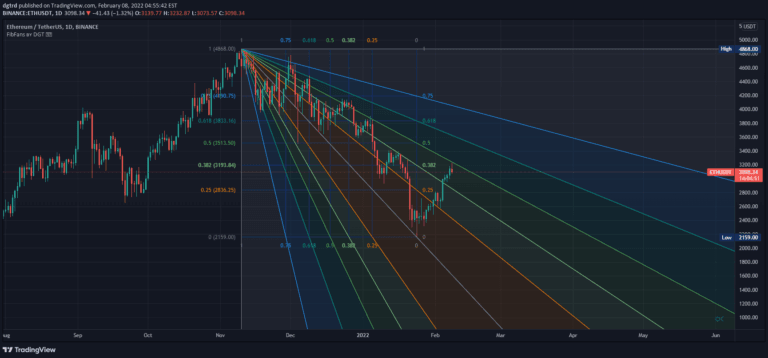
Auto Fib Speed Resistance Fans by DGT

by dgtrd

Fibonacci Speed and Resistance Fan is an analytical tool that identifies potential support and resistance levels by drawing lines based on Fibonacci percentages to predict trend changes and market movements.

Main price chart · unverifiedDay Trading · Swing Trading
Explore
5.8Klikes142.5Kviews133comments
Save
VolumeEditor’s pick

Volume Footprint Voids [BigBeluga]

by BigBeluga

Volume Footprint Voids is a trading indicator that uses lower timeframe calculations to plot single candle Point of Control (POC) and identify volume imbalances for precise entry and exit points.

Main price chart · unverifiedScalping · Day Trading
Explore
4.3Klikes135.4Kviews37comments
Save
LevelsTrendVolume

Volume Profile Plus

by AlphaViz

Advanced volume profile indicator offering high-resolution analysis of trading volume across multiple range modes, providing traders with detailed insights into market structure and price-volume relationships.

Main price chart · unverifiedScalping · Day Trading
Explore
3.7Klikes57.9Kviews36comments
Save
TrendSignalEditor’s pick

AR Forecast Scatterplot [SS]

by Steversteves

An autoregressive scatter plot forecaster that uses statistical coefficients to predict price movement by analyzing historical trends and creating probabilistic predictions.

Main price chart · unverifiedDay Trading · Swing Trading
Explore
3.6Klikes99.1Kviews88comments
Save
MomentumOscillatorTrend

RSI Trail [UAlgo]

by UAlgo

RSI Trail is a technical analysis tool that uses Relative Strength Index and moving averages to dynamically plot support and resistance levels, helping traders identify market trends and potential entry/exit points.

Main price chart · unverifiedScalping · Day Trading
Explore
3.5Klikes44.5Kviews28comments
Save
VolumeTrendSignalEditor’s pick

Ehlers Loops [BigBeluga]

by BigBeluga

The Ehlers Loops indicator reveals price and volume dynamics through a quadrant-based visual representation, helping traders understand market momentum and potential trend reversals.

Separate pane · unverifiedScalping · Day Trading
Explore
3Klikes107.3Kviews26comments
Save
LevelsSignal

HTF Liquidity Dashboard [TFO]

by tradeforopp

A multi-symbol scanner that tracks price movements against previous day, week, and month highs and lows, providing visual and alert-based tracking of key market levels.

Main price chart · unverifiedScalping · Day Trading
Explore
2.7Klikes65.9Kviews26comments
Save
TrendMomentumEditor’s pick

Color Gradient Framework [PineCoders]

by PineCoders

A Pine Script color gradient generator that enables dynamic color generation for trading indicators, providing flexible visualization techniques for market analysis and signal representation.

Main price chart · unverifiedDay Trading · Swing Trading
Explore
2.7Klikes54.5Kviews38comments
Save
VolumeTrendEditor’s pick

Open Interest Chart [LuxAlgo]

by LuxAlgo

Open Interest Chart visualizes futures market activity using a circular plot that tracks percentage changes in open interest, indicating money flow and market liquidity.

Separate pane · unverifiedDay Trading · Swing Trading
Explore
2.4Klikes119Kviews23comments
Save

Likes, views, and comments are historical TradingView snapshots. They describe attention, not trading performance.

START WITH A QUESTION

A little less searching.
A lot more understanding.

Tell DeepAlpha what you need. Get an explanation, a shortlist,
and a direct path to the indicators behind it.

Ask DeepAlpha
