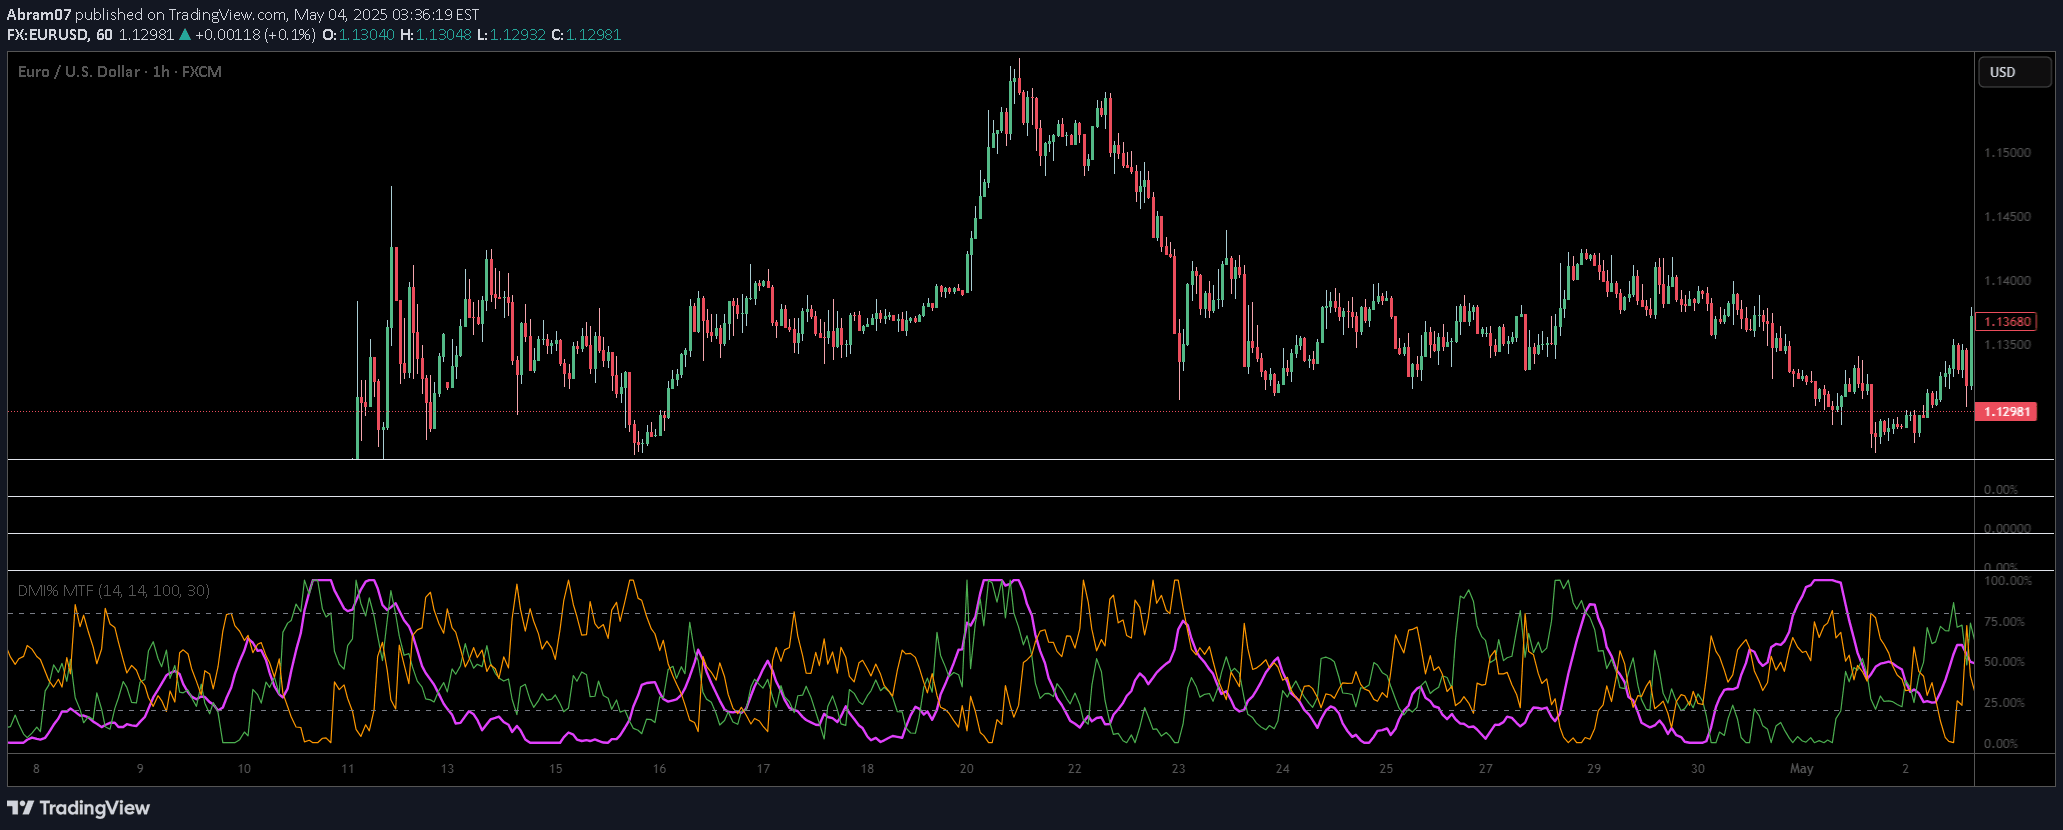
A multi-timeframe Fibonacci indicator that automatically displays Fibonacci retracements from multiple Zigzag lines, enabling advanced trading analysis and custom alert configurations.
Explore complementary indicator rolesHow it works
This Fibonacci indicator calculates retracement levels using three different Zigzag periods, allowing traders to analyze price movements across multiple timeframes. By selecting different Zigzag periods like 8, 25, and 100, traders can create Fibonacci levels from higher timeframe highs and lows and overlay them on lower timeframes.
The indicator provides flexibility in Fibonacci calculation by offering two leg selection modes: 'Latest' and 'Previous'. These modes determine whether the Fibonacci levels are drawn based on the most recent Zigzag line or the previous Zigzag line, giving traders multiple perspectives on potential price retracements.
Why it may be useful
Multi-timeframe Fibonacci analysis helps traders identify potential support and resistance levels with greater precision and context. By integrating Zigzag lines from different timeframes, traders can gain insights into broader market trends and potential price reversals that might not be visible on a single timeframe.
The customizable alert system for each Fibonacci level allows traders to create precise entry and exit strategies. Alerts can be set for crossing specific percentage levels like 23.6%, 38.2%, 50%, and 61.8%, enabling traders to monitor potential discount or premium zones across different market conditions.
When to explore it
This indicator is most effective in markets with clear trending characteristics and sufficient price volatility. Traders can optimize its use during periods of consolidation or when expecting potential trend reversals, where Fibonacci retracement levels can provide critical insights into potential support and resistance zones.
The multi-timeframe approach is particularly useful for traders seeking comprehensive market analysis, helping them understand price movements across different time horizons. It's especially valuable for traders who want to align their short-term trading decisions with broader market trends and seek more nuanced entry and exit points.
Keep exploring
What we’ve verified
Access, alerts and repainting behaviour have not been independently verified for this indicator. Check the creator’s current publication and settings.
General descriptions and classifications are recovered research. Verified details above identify the specific checks we have completed. Check the creator’s current publication for later changes.