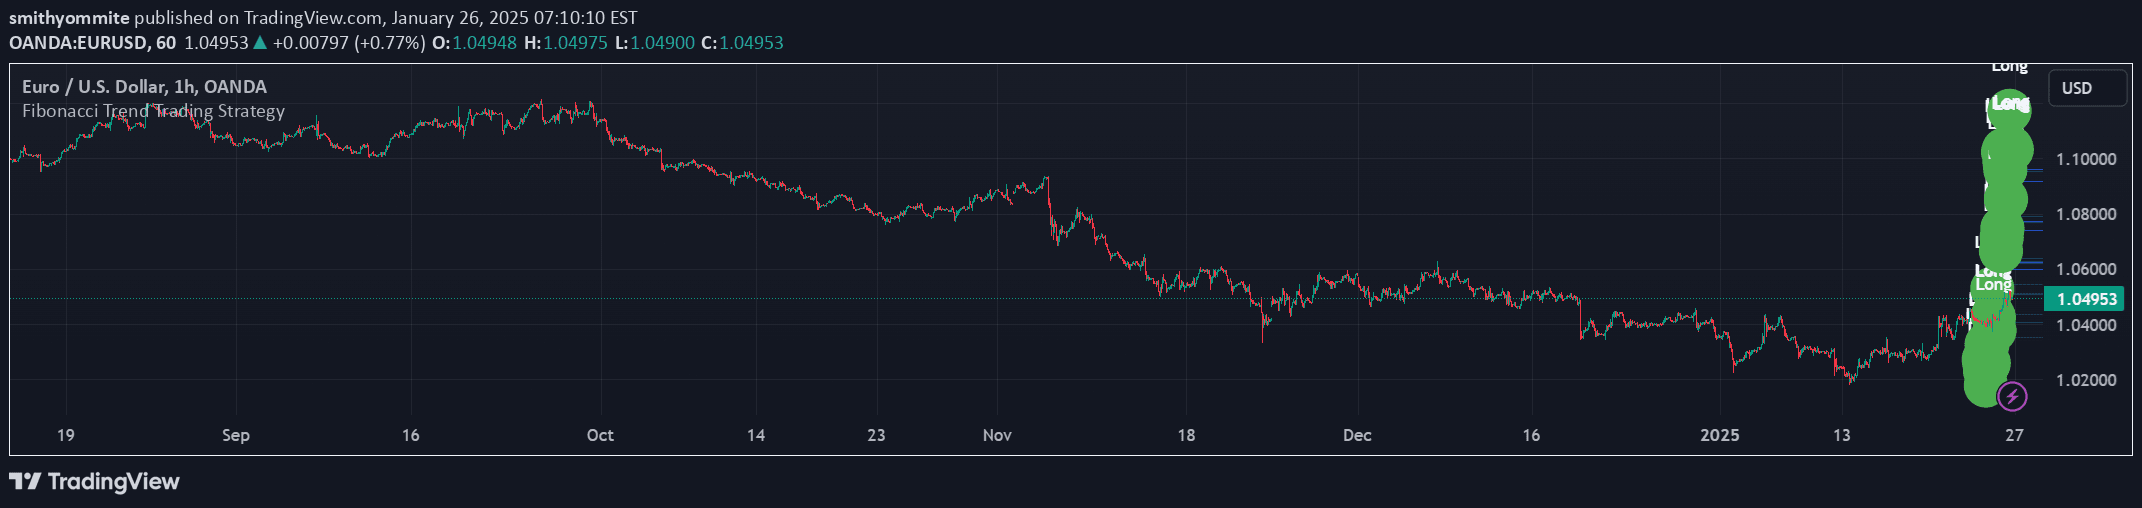
A comprehensive trading tool combining order blocks and Fibonacci retracements to identify potential market entry and exit points based on significant order zones and mathematical support/resistance levels.
Explore complementary indicator rolesHow it works
The indicator first identifies order blocks by detecting consecutive aggressive bullish or bearish bars representing areas of significant market player activity. These order blocks are zones where large traders have potentially placed substantial buy or sell orders, creating a footprint of market sentiment.
Once an order block is detected, the tool automatically generates Fibonacci retracement levels in real-time, tracking potential support and resistance zones. The Fibonacci levels are dynamically updated until the selected retracement level is reached or a new, more relevant order block emerges, providing traders with continuously evolving market insights.
Why it may be useful
Order blocks and Fibonacci retracements offer traders a sophisticated method of understanding market dynamics by revealing where significant trading activity has occurred and potential price reversal zones. By combining these two analytical approaches, traders gain deeper insights into market structure, helping them make more informed trading decisions.
The indicator's ability to highlight areas of potential market interest allows traders to identify high-probability entry and exit points with greater precision. This approach provides a more nuanced view of market movements, helping traders understand not just price action, but the underlying order flow and institutional trading activity.
When to explore it
This indicator is most effective in markets with clear trending behavior and substantial institutional trading activity, such as forex, futures, and major stock indices. Traders can utilize the tool when seeking to identify potential reversal zones, confirm trend strength, and locate high-probability entry and exit points based on order block and Fibonacci analysis.
The indicator is particularly useful during periods of market consolidation or when price approaches key support and resistance levels. Traders should combine this tool with other technical and fundamental analysis methods to enhance its effectiveness and reduce false signal risks.
Keep exploring
What we’ve verified
Access, alerts and repainting behaviour have not been independently verified for this indicator. Check the creator’s current publication and settings.
General descriptions and classifications are recovered research. Verified details above identify the specific checks we have completed. Check the creator’s current publication for later changes.