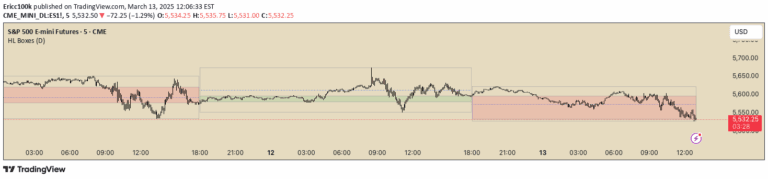
A dynamic indicator tracking price drops from recent highs, helping traders identify significant pullbacks and potential reversal zones with customizable percentage and lookback settings.
Explore complementary indicator rolesHow it works
The 10% Drop from Current High indicator continuously monitors price action by tracking the highest price within a user-defined lookback period. It calculates a dynamic drop level based on a preset percentage (default 10%) below the current high, creating visual markers and reference points on the price chart.
When the current price approaches or falls below this predefined drop level, the indicator activates visual signals such as translucent red background highlighting and a downward label. These visual cues help traders quickly recognize significant price pullbacks and potential trend reversals.
Why it may be useful
This indicator provides traders with a precise and customizable method to track meaningful price retracements, offering insights into potential market turning points. By dynamically adjusting to market conditions, it helps traders identify when an asset might be experiencing a significant correction or preparing for a trend change.
The visual alerts and flexible configuration allow traders to adapt the tool to different market environments, assets, and trading strategies. It serves as an objective, mechanical approach to recognizing price movements that might signal important trading opportunities.
When to explore it
The 10% Drop from Current High indicator is most effective in markets with clear trending characteristics, where price moves have identifiable highs and potential pullback zones. It works particularly well in volatile markets where quick identification of trend reversals can provide trading advantages.
Traders can optimize its use by combining it with other technical indicators to confirm signals and validate potential entry or exit points. It is especially useful for momentum traders, trend followers, and those seeking systematic approaches to identifying significant price retracements.
Keep exploring
What we’ve verified
Access, alerts and repainting behaviour have not been independently verified for this indicator. Check the creator’s current publication and settings.
General descriptions and classifications are recovered research. Verified details above identify the specific checks we have completed. Check the creator’s current publication for later changes.