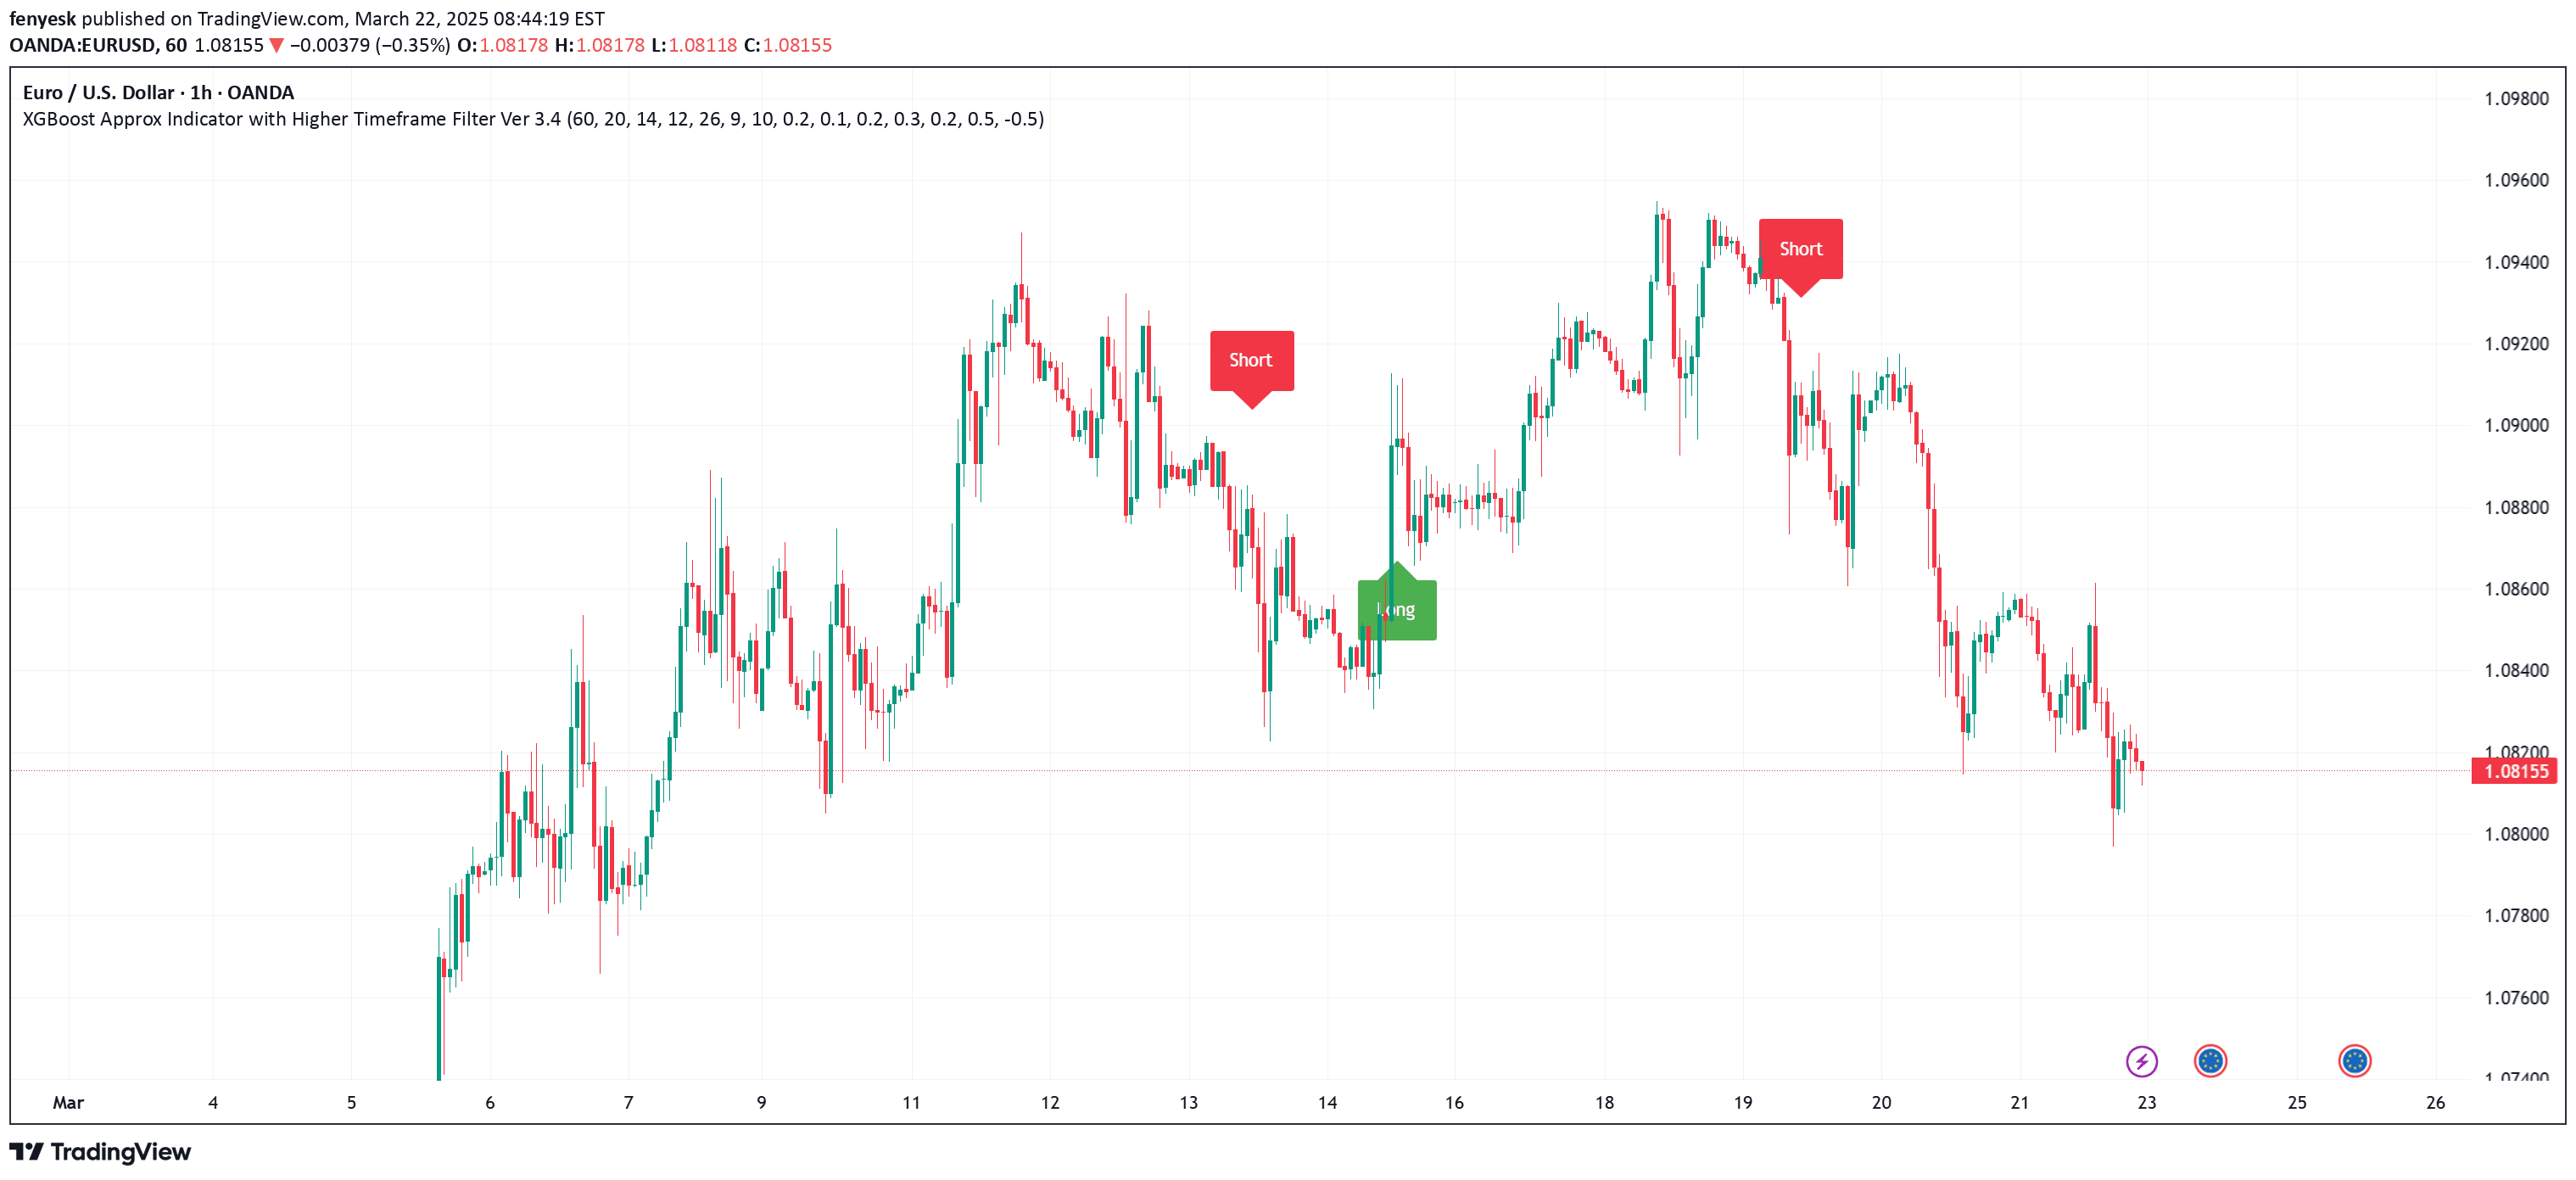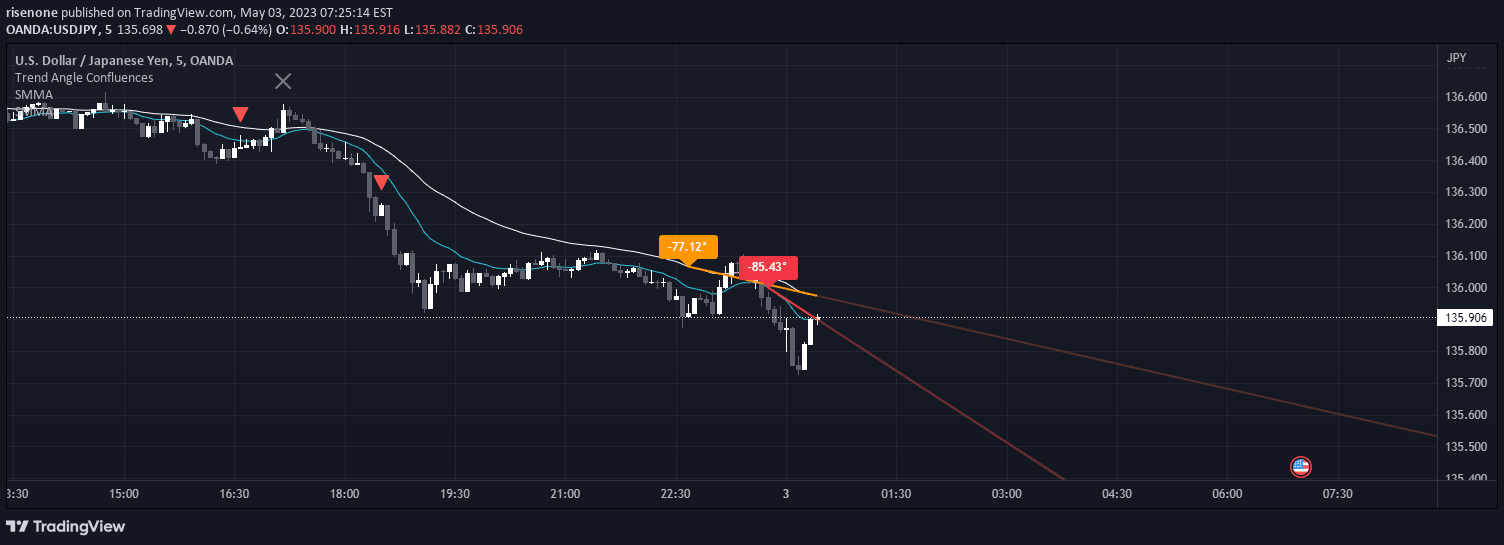
A trend analysis indicator that evaluates market direction by calculating the angle of price movement over a selected look-back period and color-coding trend strength.
Explore complementary indicator rolesHow it works
The indicator begins by allowing traders to select a specific data source and choose a look-back period for analysis. It then calculates the angle of price movement during that selected timeframe, providing a quantitative measure of trend direction and momentum.
By translating price movement into a degree measurement, the indicator transforms complex price data into a simple, visual representation. The color-coding mechanism helps traders quickly interpret market sentiment, with specific colors indicating bullish or bearish trend characteristics.
Why it may be useful
This trend analysis tool provides traders with a straightforward method to understand market direction and momentum without complex calculations. By converting price movement into an easily digestible angle measurement, it helps traders make faster and more intuitive trading decisions.
The visual color-coding adds an additional layer of quick interpretation, allowing traders to rapidly assess market sentiment and potential trading opportunities. This simplification can be particularly useful for newer traders who might find traditional trend indicators challenging to understand.
When to explore it
The indicator works best in markets with clear directional movements, such as trending stock indices, forex pairs, and certain commodities. It is particularly effective during periods of sustained price movement where the trend angle can provide meaningful insights into market momentum.
Traders should be cautious when using this indicator in highly volatile or sideways markets, where trend angles might provide less reliable signals. Combining this indicator with other technical analysis tools can help confirm signals and improve overall trading strategy reliability.
Keep exploring
What we’ve verified
Access, alerts and repainting behaviour have not been independently verified for this indicator. Check the creator’s current publication and settings.
General descriptions and classifications are recovered research. Verified details above identify the specific checks we have completed. Check the creator’s current publication for later changes.