
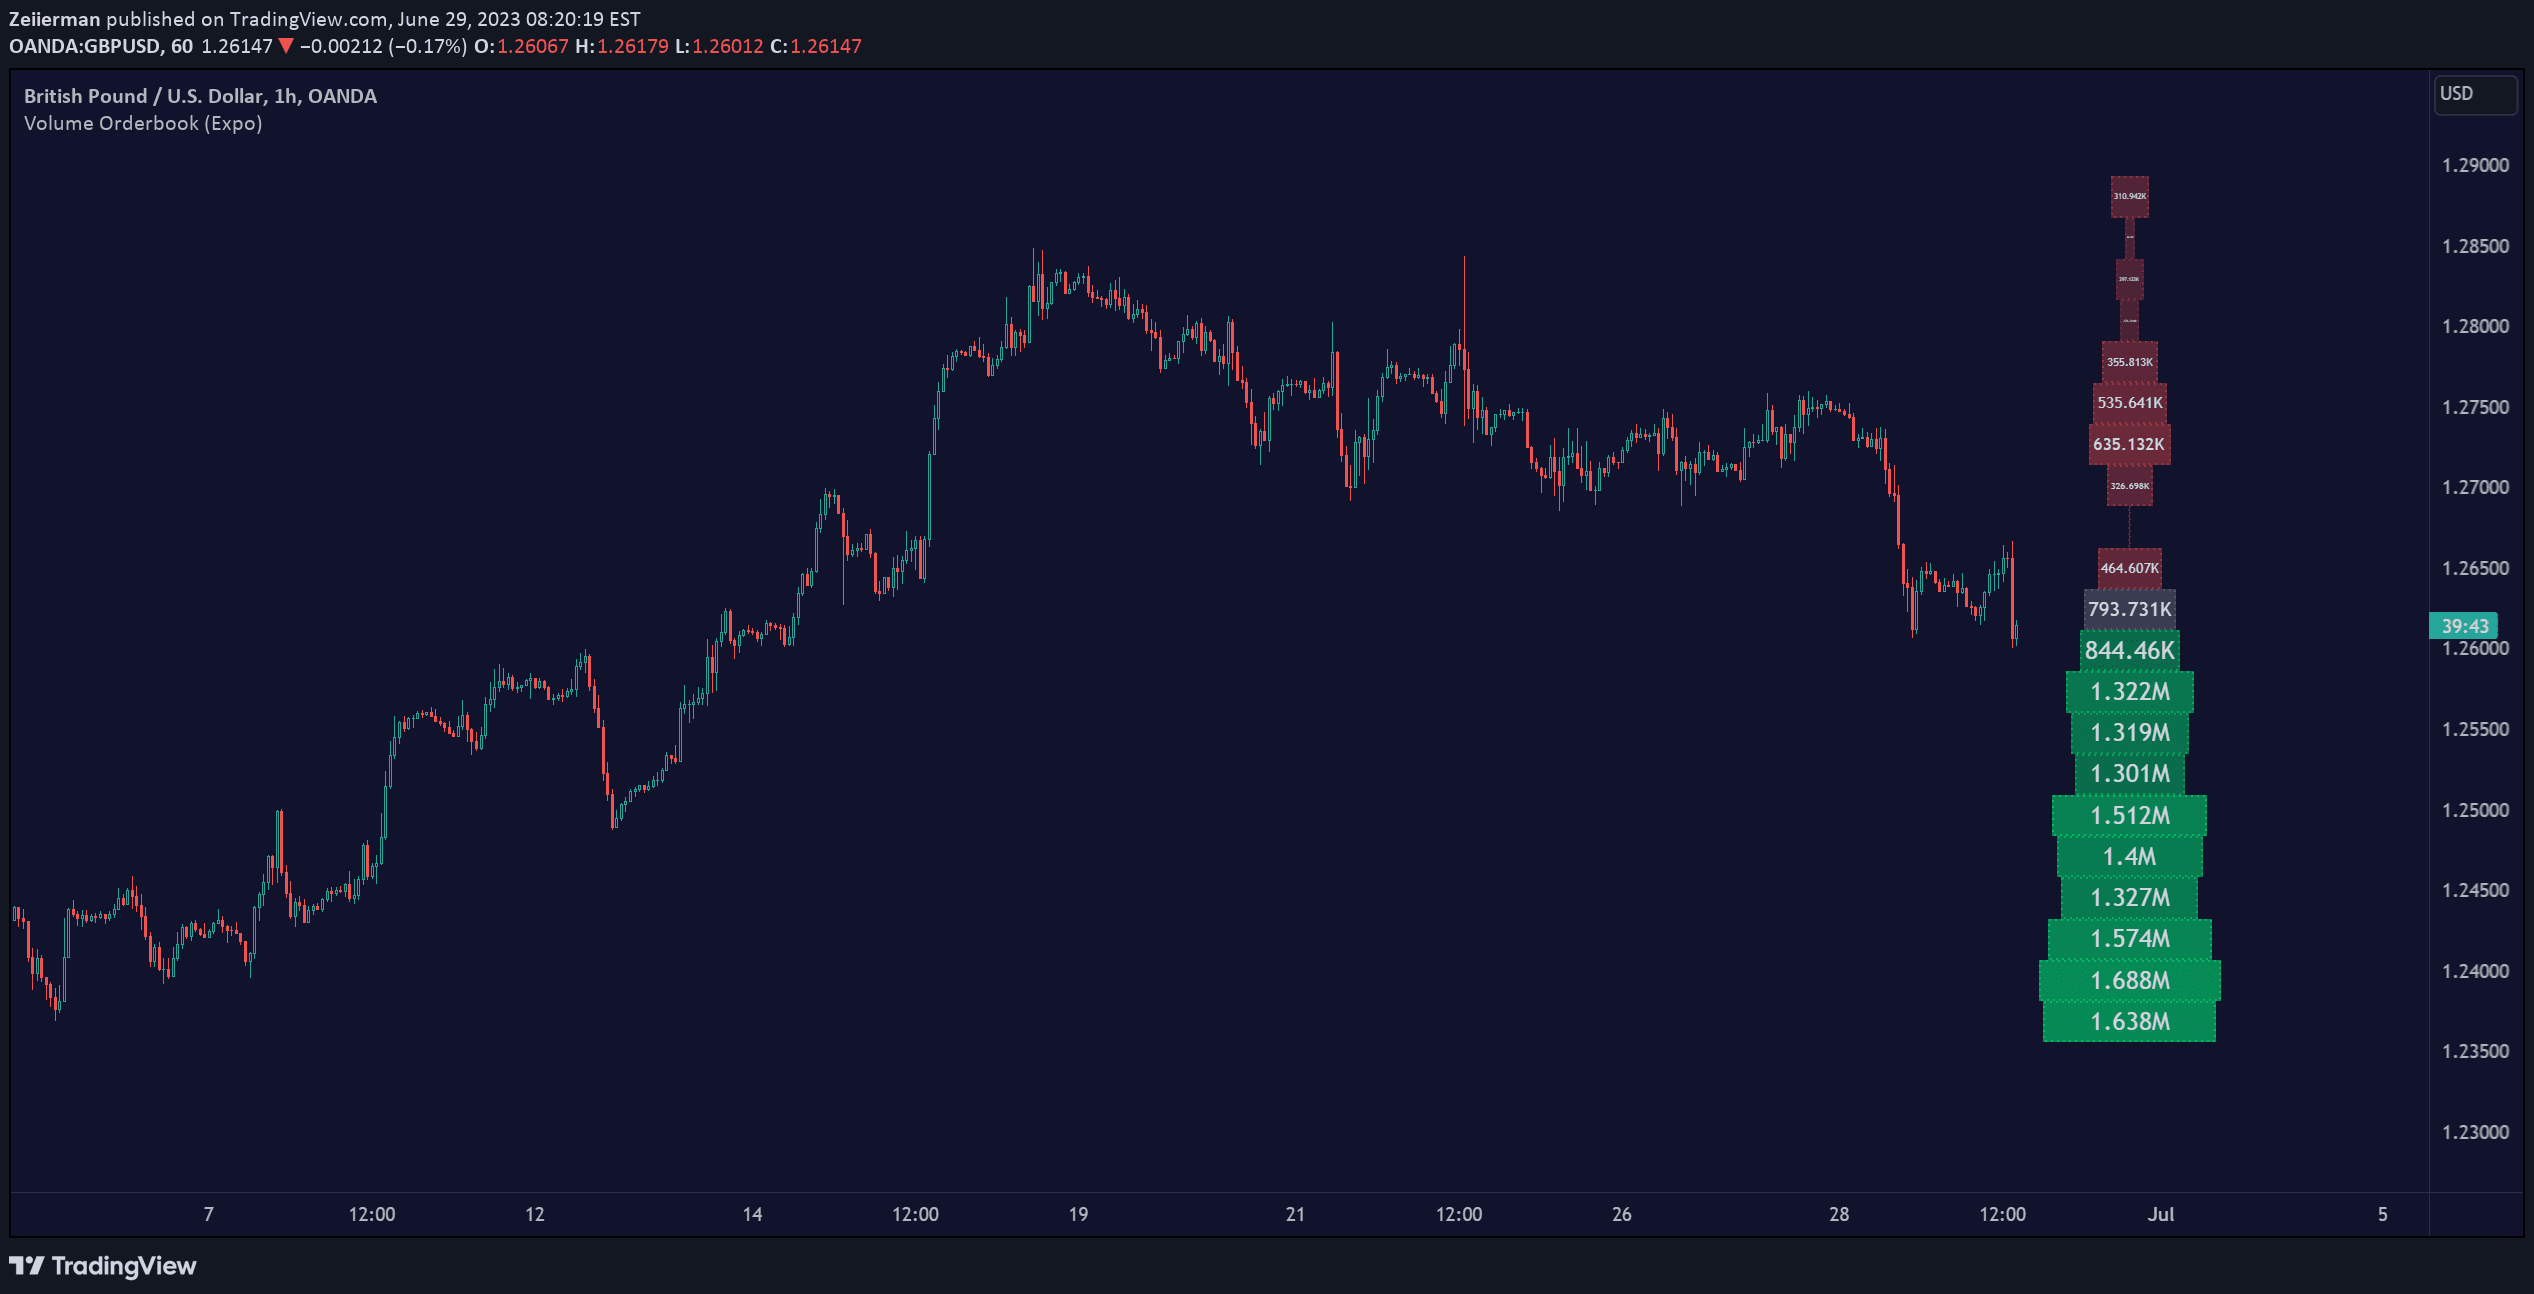
Volume Orderbook (Expo)
Volume Orderbook is a visual trading tool that displays trading volume across different price levels, helping traders identify significant market activity zones and potential support/resistance areas.
Explore 11,183 indicators. Filter beyond the obvious.
Discover the tools that fit the way you trade.
11,183 tools to explore
Volume Orderbook is a visual trading tool that displays trading volume across different price levels, helping traders identify significant market activity zones and potential support/resistance areas.
The Congestion Index identifies market phases by measuring price changes relative to price range, helping traders distinguish between trending and range-bound markets.
A dynamic trading tool that uses Fibonacci ratios to calculate intraday support and resistance levels based on the average price range of the past 14 trading days.
Transaction Fee Spike tracks bitcoin network transaction fees to identify potential market mania phases and potential price tops, signaling when fees exceed historical thresholds.
An adaptive moving average that dynamically adjusts its smoothing factor based on market volatility, tracking price movements more accurately during trending and congestion periods.
Advanced technical analysis tool combining multiple density calculation methods to identify significant price levels, market structure, and trading activity zones through sophisticated visualization techniques.
An advanced adaptive moving average that dynamically adjusts its parameters based on market volatility, providing flexible and responsive price tracking across different market conditions.
A tool for drawing multiple horizontal lines on a chart to identify key support and resistance levels across different price points, helping traders visualize potential trading zones.
Bitcoin transaction cost indicator that analyzes network activity to provide insights into potential market tops and bottoms by measuring transaction expenses and network usage.
A comprehensive market hours indicator that helps traders visualize global trading sessions, liquidity phases, and potential market activity across different timeframes.
A specialized indicator that highlights the night trading session from 20:00 to 07:00, helping traders analyze market congestion and anticipate morning volatility breakouts.
A trading signal that identifies price congestion zones where multiple candlesticks trade within a specific range, highlighting potential support and resistance areas.
Likes, views, and comments are historical TradingView snapshots. They describe attention, not trading performance.
