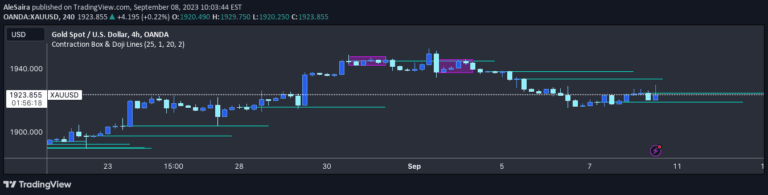
A trading signal that identifies price congestion zones where multiple candlesticks trade within a specific range, highlighting potential support and resistance areas.
Explore complementary indicator rolesHow it works
Congestion signals identify specific price zones where multiple consecutive candlesticks trade within the range of an initial candle. The formation requires a main candle and at least three subsequent candles with bodies contained within the original candle's price range. The congestion is considered closed when a candle closes outside this established range, signaling a potential breakout or trend change.
Traders can visually track these congestion zones on price charts, which help map out areas of price consolidation and potential future support or resistance levels. By projecting these zones forward, traders can anticipate potential price interactions and develop strategic entry or exit points based on the historical price behavior.
Why it may be useful
Congestion signals provide traders with critical insights into market dynamics by revealing periods of price consolidation and potential trend reversals. These signals help identify areas where market participants are balancing between buying and selling pressures, creating zones of significant trading interest.
By understanding these congestion zones, traders can make more informed decisions about potential breakouts, support and resistance levels, and overall market sentiment. The signal offers a visual representation of market indecision and can be a powerful tool for predicting future price movements across different trading timeframes.
When to explore it
Congestion signals are most effective in markets with moderate volatility where price tends to consolidate before making significant moves. They work particularly well in identifying potential breakout points and understanding market sentiment during periods of price compression.
Traders should utilize these signals when looking to confirm trend reversals, identify potential entry and exit points, and assess market strength. They are especially useful in identifying key support and resistance zones across various financial instruments and timeframes, providing a versatile tool for technical analysis.
Keep exploring
What we’ve verified
Access, alerts and repainting behaviour have not been independently verified for this indicator. Check the creator’s current publication and settings.
General descriptions and classifications are recovered research. Verified details above identify the specific checks we have completed. Check the creator’s current publication for later changes.