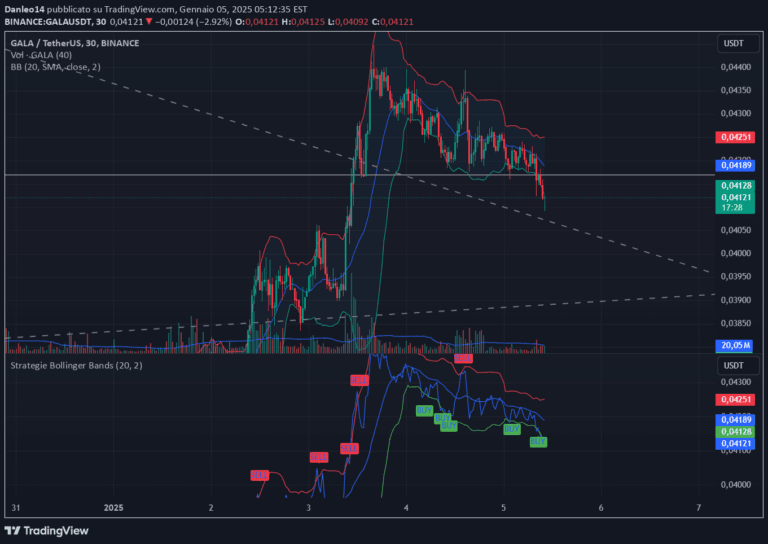
A customized Bollinger Bands indicator that generates buy and sell signals by tracking price interactions with dynamic upper and lower bands, helping traders identify market volatility and potential entry points.
Explore complementary indicator rolesHow it works
The indicator calculates a simple moving average (SMA) as its central line, then creates upper and lower bands by adding and subtracting standard deviations multiplied by a specific factor. These bands dynamically expand and contract based on market price volatility, creating a flexible framework for tracking price movements.
Trading signals are generated when price crosses these bands, with a buy signal triggered when price moves above the lower band and a sell signal activated when price drops below the upper band. The indicator also uses color-coded backgrounds to visually highlight these signal moments, making it easier for traders to quickly identify potential trading opportunities.
Why it may be useful
Bollinger Bands provide traders with a sophisticated method of understanding market volatility and potential price reversals by creating dynamic support and resistance levels. The bands offer visual insights into market conditions, helping traders assess whether an asset is potentially overbought or oversold based on its relationship to the moving average.
By generating clear buy and sell signals, this indicator simplifies complex market analysis, allowing traders to make more informed decisions. The combination of visual band expansions and precise signal generation makes it a powerful tool for identifying potential entry and exit points across different market conditions.
When to explore it
This indicator works best in trending markets with moderate volatility, where price movements are consistent enough to generate meaningful signals without excessive noise. Traders should use it most effectively on timeframes ranging from minutes to hours, particularly for assets with predictable price behavior.
The indicator is particularly useful when combined with other technical analysis tools to confirm signals and reduce the risk of false positives. It's most reliable when used in markets that demonstrate clear directional movements, such as stocks, cryptocurrencies, and forex pairs with established trends.
Keep exploring
What we’ve verified
Access, alerts and repainting behaviour have not been independently verified for this indicator. Check the creator’s current publication and settings.
General descriptions and classifications are recovered research. Verified details above identify the specific checks we have completed. Check the creator’s current publication for later changes.