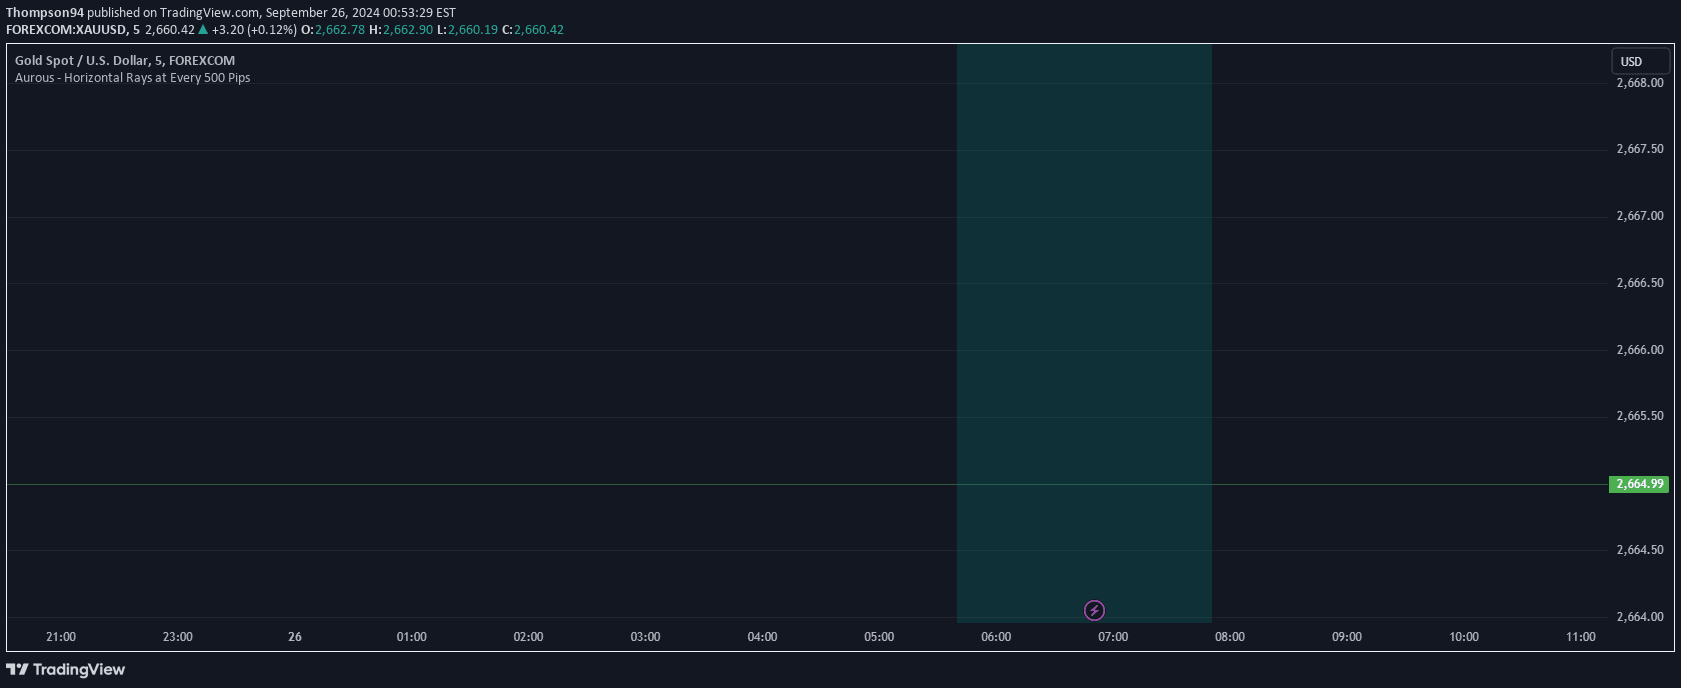
A tool for drawing multiple horizontal lines on a chart to identify key support and resistance levels across different price points, helping traders visualize potential trading zones.
Explore complementary indicator rolesHow it works
Horizontal lines are drawn at specific price levels to mark important support and resistance zones on a trading chart. Traders input precise price points where they believe significant market activity might occur, creating visual reference lines that help identify potential entry, exit, or stop-loss points.
The tool allows flexibility in marking multiple lines with different color groups, enabling traders to distinguish between various levels of importance or different types of price zones. By simply entering comma-separated prices, traders can quickly map out key technical levels that might represent historical price congestion, previous swing highs and lows, or other significant market turning points.
Why it may be useful
Horizontal lines provide crucial visual markers that help traders understand potential price barriers and key decision-making zones in the market. They transform abstract price data into clear, actionable visual information that can guide trading decisions and risk management strategies.
By marking support and resistance levels, traders can anticipate potential price reactions, identify areas of potential trend reversal, and create more structured trading plans. These lines serve as psychological price levels where market participants might collectively make trading decisions, making them powerful tools for understanding market dynamics and potential price movements.
When to explore it
Horizontal lines are most effective in markets with clear range-bound or consolidating price action, where prices repeatedly interact with specific levels. They work exceptionally well in identifying potential bounce or rejection zones where prices have historically shown significant reactions.
Traders should use these lines in conjunction with other technical analysis tools to confirm potential trade setups. They are particularly useful in markets with clear historical price patterns, such as stocks, forex, and futures, where price memory and institutional trading levels play a significant role in market movements.
Keep exploring
What we’ve verified
Access, alerts and repainting behaviour have not been independently verified for this indicator. Check the creator’s current publication and settings.
General descriptions and classifications are recovered research. Verified details above identify the specific checks we have completed. Check the creator’s current publication for later changes.