
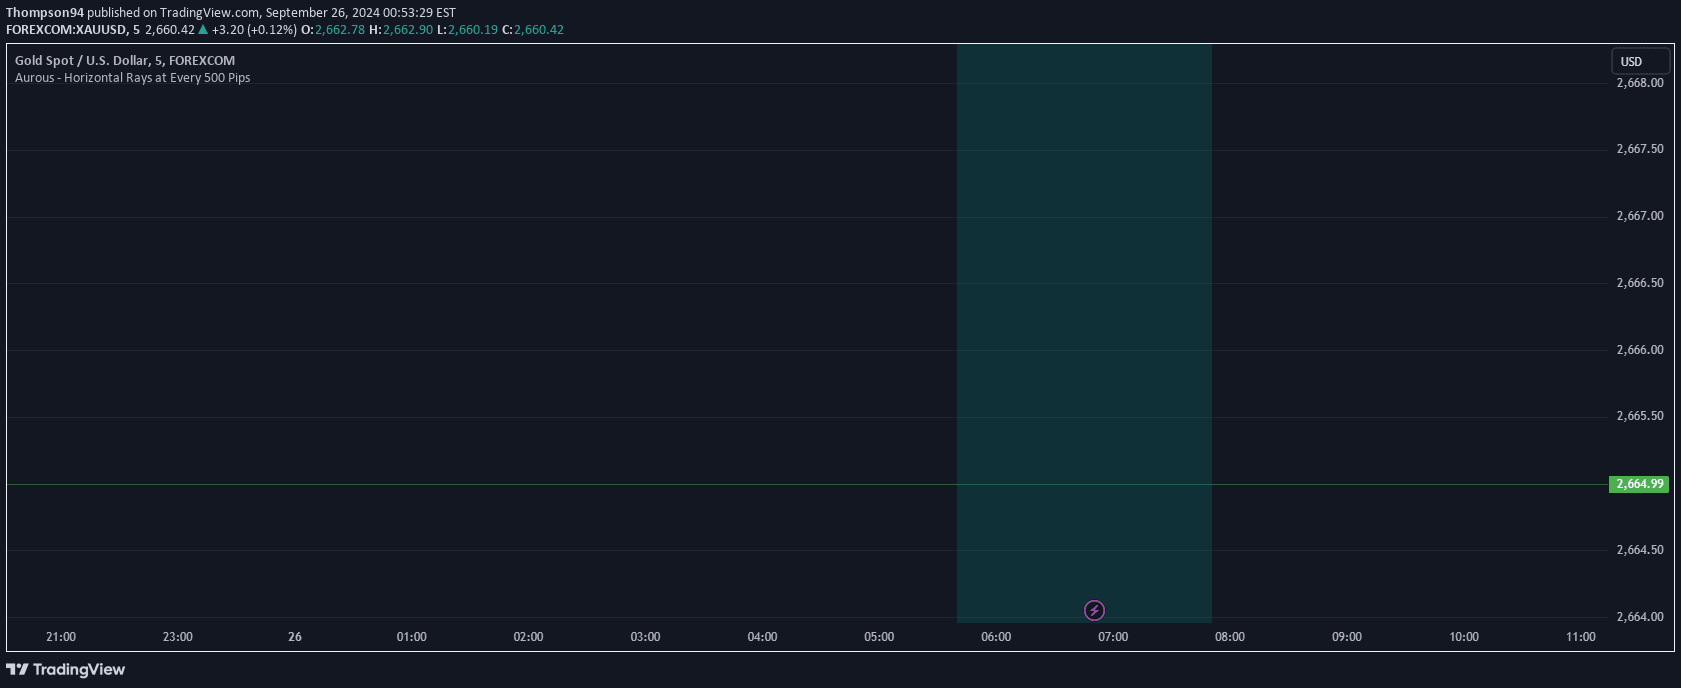
A trading strategy for XAUUSD that plots horizontal ray lines at 50-pip intervals around the current price, helping traders identify potential support and resistance levels.
Explore complementary indicator rolesHow it works
The strategy begins by defining a pip size of 0.1 for XAUUSD, which allows for precise level identification. It calculates the nearest 50-pip level by rounding the current price to the nearest multiple of the pip interval, creating a systematic approach to price analysis.
Using a loop that ranges from -20 to 20, the strategy generates horizontal ray lines both above and below the current price. These lines are extended to the right of the chart, creating a visual grid that helps traders quickly identify potential support and resistance zones around the current market price.
Why it may be useful
This approach provides traders with a clear, visual representation of potential price levels, making it easier to identify key trading zones and potential entry or exit points. By creating a structured grid around the current price, traders can quickly assess market structure and potential areas of price congestion or breakthrough.
The method offers a systematic way to view price levels, reducing emotional decision-making and providing a more objective approach to market analysis. It helps traders develop a more disciplined and strategic approach to trading by offering a consistent framework for identifying potential trading opportunities.
When to explore it
The strategy is most effective in markets with clear trending or range-bound conditions, particularly for XAUUSD (gold) trading. It works best when the market shows consistent price movements and when traders want to identify potential support and resistance levels quickly and systematically.
Traders should use this approach during periods of moderate to high market volatility, where price levels can provide meaningful insights into potential trading opportunities. It is particularly useful for short-term trading strategies, such as scalping and day trading, where quick identification of price levels can be crucial for making timely trading decisions.
Keep exploring
What we’ve verified
Access, alerts and repainting behaviour have not been independently verified for this indicator. Check the creator’s current publication and settings.
General descriptions and classifications are recovered research. Verified details above identify the specific checks we have completed. Check the creator’s current publication for later changes.


