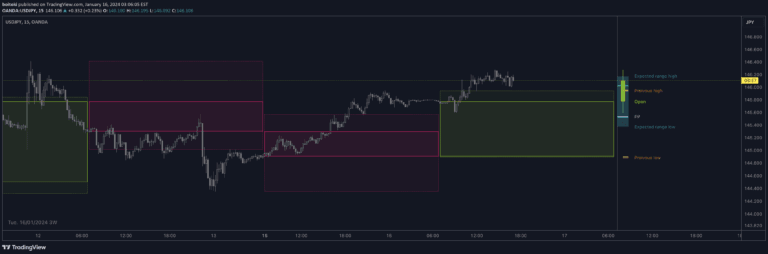
Volume Profile with Node Detection [LuxAlgo]
A volume profile charting tool that visualizes trading volume distribution across price levels, detecting significant volume nodes and clusters for strategic trading insights.
Explore 11,183 indicators. Filter beyond the obvious.
Discover the tools that fit the way you trade.
11,183 tools to explore
A volume profile charting tool that visualizes trading volume distribution across price levels, detecting significant volume nodes and clusters for strategic trading insights.
An indicator that identifies divergences between swing points of a chart symbol and two external tickers, providing statistical insights into price behavior correlation.
A non-linear regression indicator analyzing multiple price variables to generate trading signals using machine learning techniques and gradient descent optimization.
A dynamic asset rotation system analyzing six assets using multiple trend indicators to identify and hold the most optimal performing asset against USD and across asset pairs.
A currency strength indicator that measures relative performance of currencies by comparing their exchange rates and tracking their strength over time using a specialized meter and scatter plot.
A multi-timeframe candle visualization tool that allows flexible display of historical price data with pivot point calculations and customizable viewing options.
A relative strength indicator comparing a stock's performance to an index by measuring the distance from moving averages, providing insights into comparative market behavior.
A financial analysis tool that compares quarterly, annual, and TTM performance metrics, providing comprehensive insights into company growth through various financial indicators and visualization options.
A Pine Script technique for combining multiple cryptocurrency price data into a single composite ticker using advanced request.security() method, enabling efficient multi-ticker analysis.
A Pine Script indicator that compares financial metrics across multiple companies in the same sector, providing comprehensive insights into stock performance using key financial ratios and moving averages.
A comprehensive trading tool that compares fundamental metrics across multiple assets using various charting methods, enabling detailed financial analysis and visualization.
A polar chart tool that visualizes cryptocurrency dominance by combining traded dollar volume and volatility across multiple timeframes for easy comparative analysis.
Likes, views, and comments are historical TradingView snapshots. They describe attention, not trading performance.