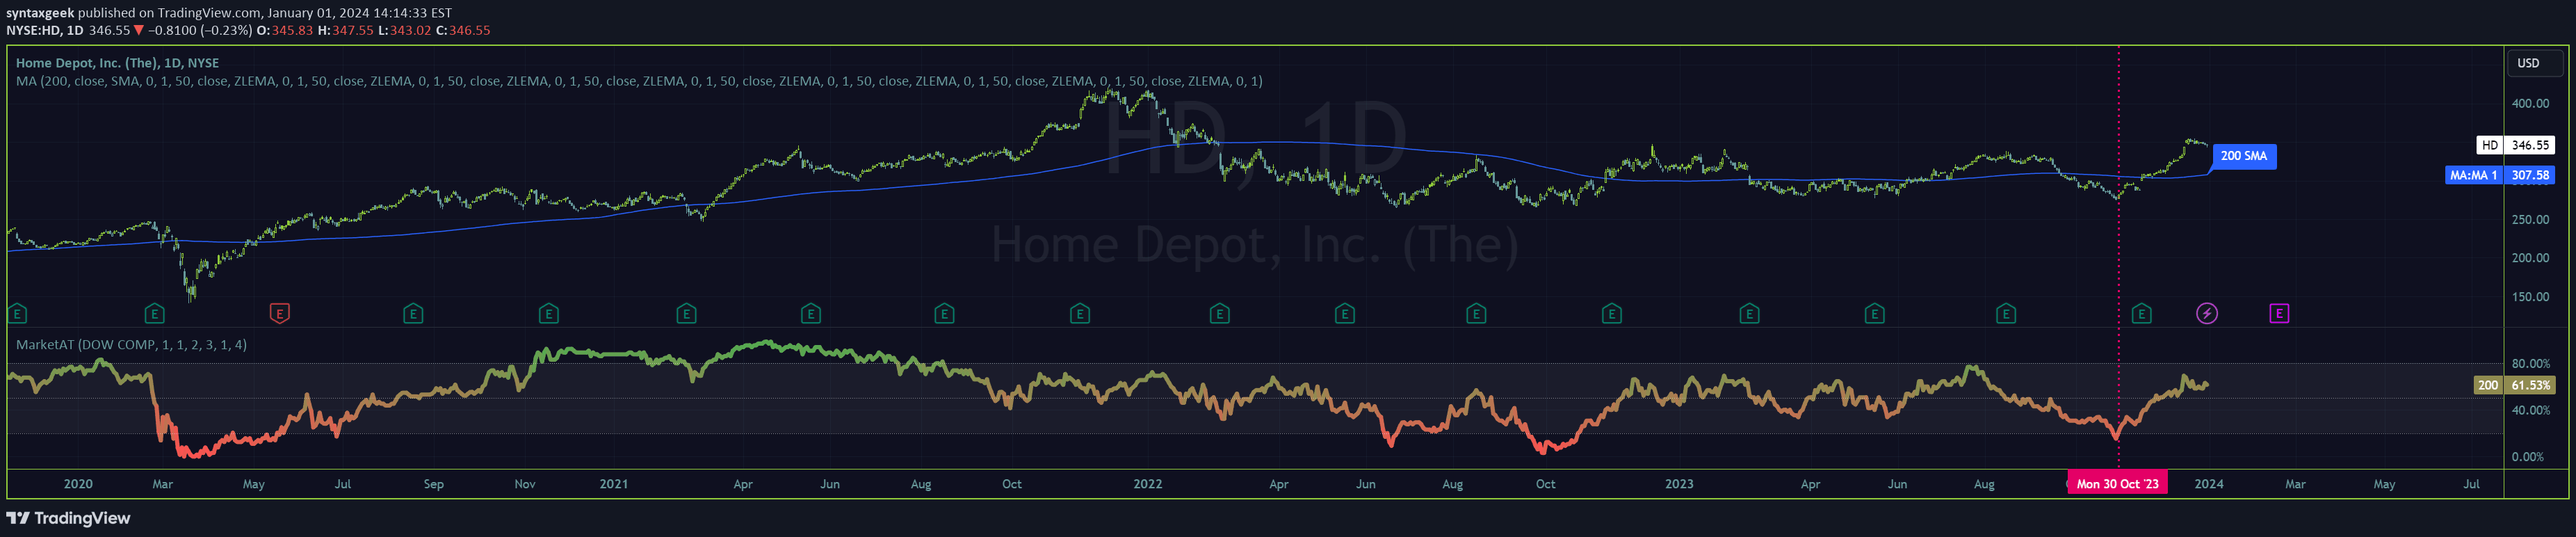
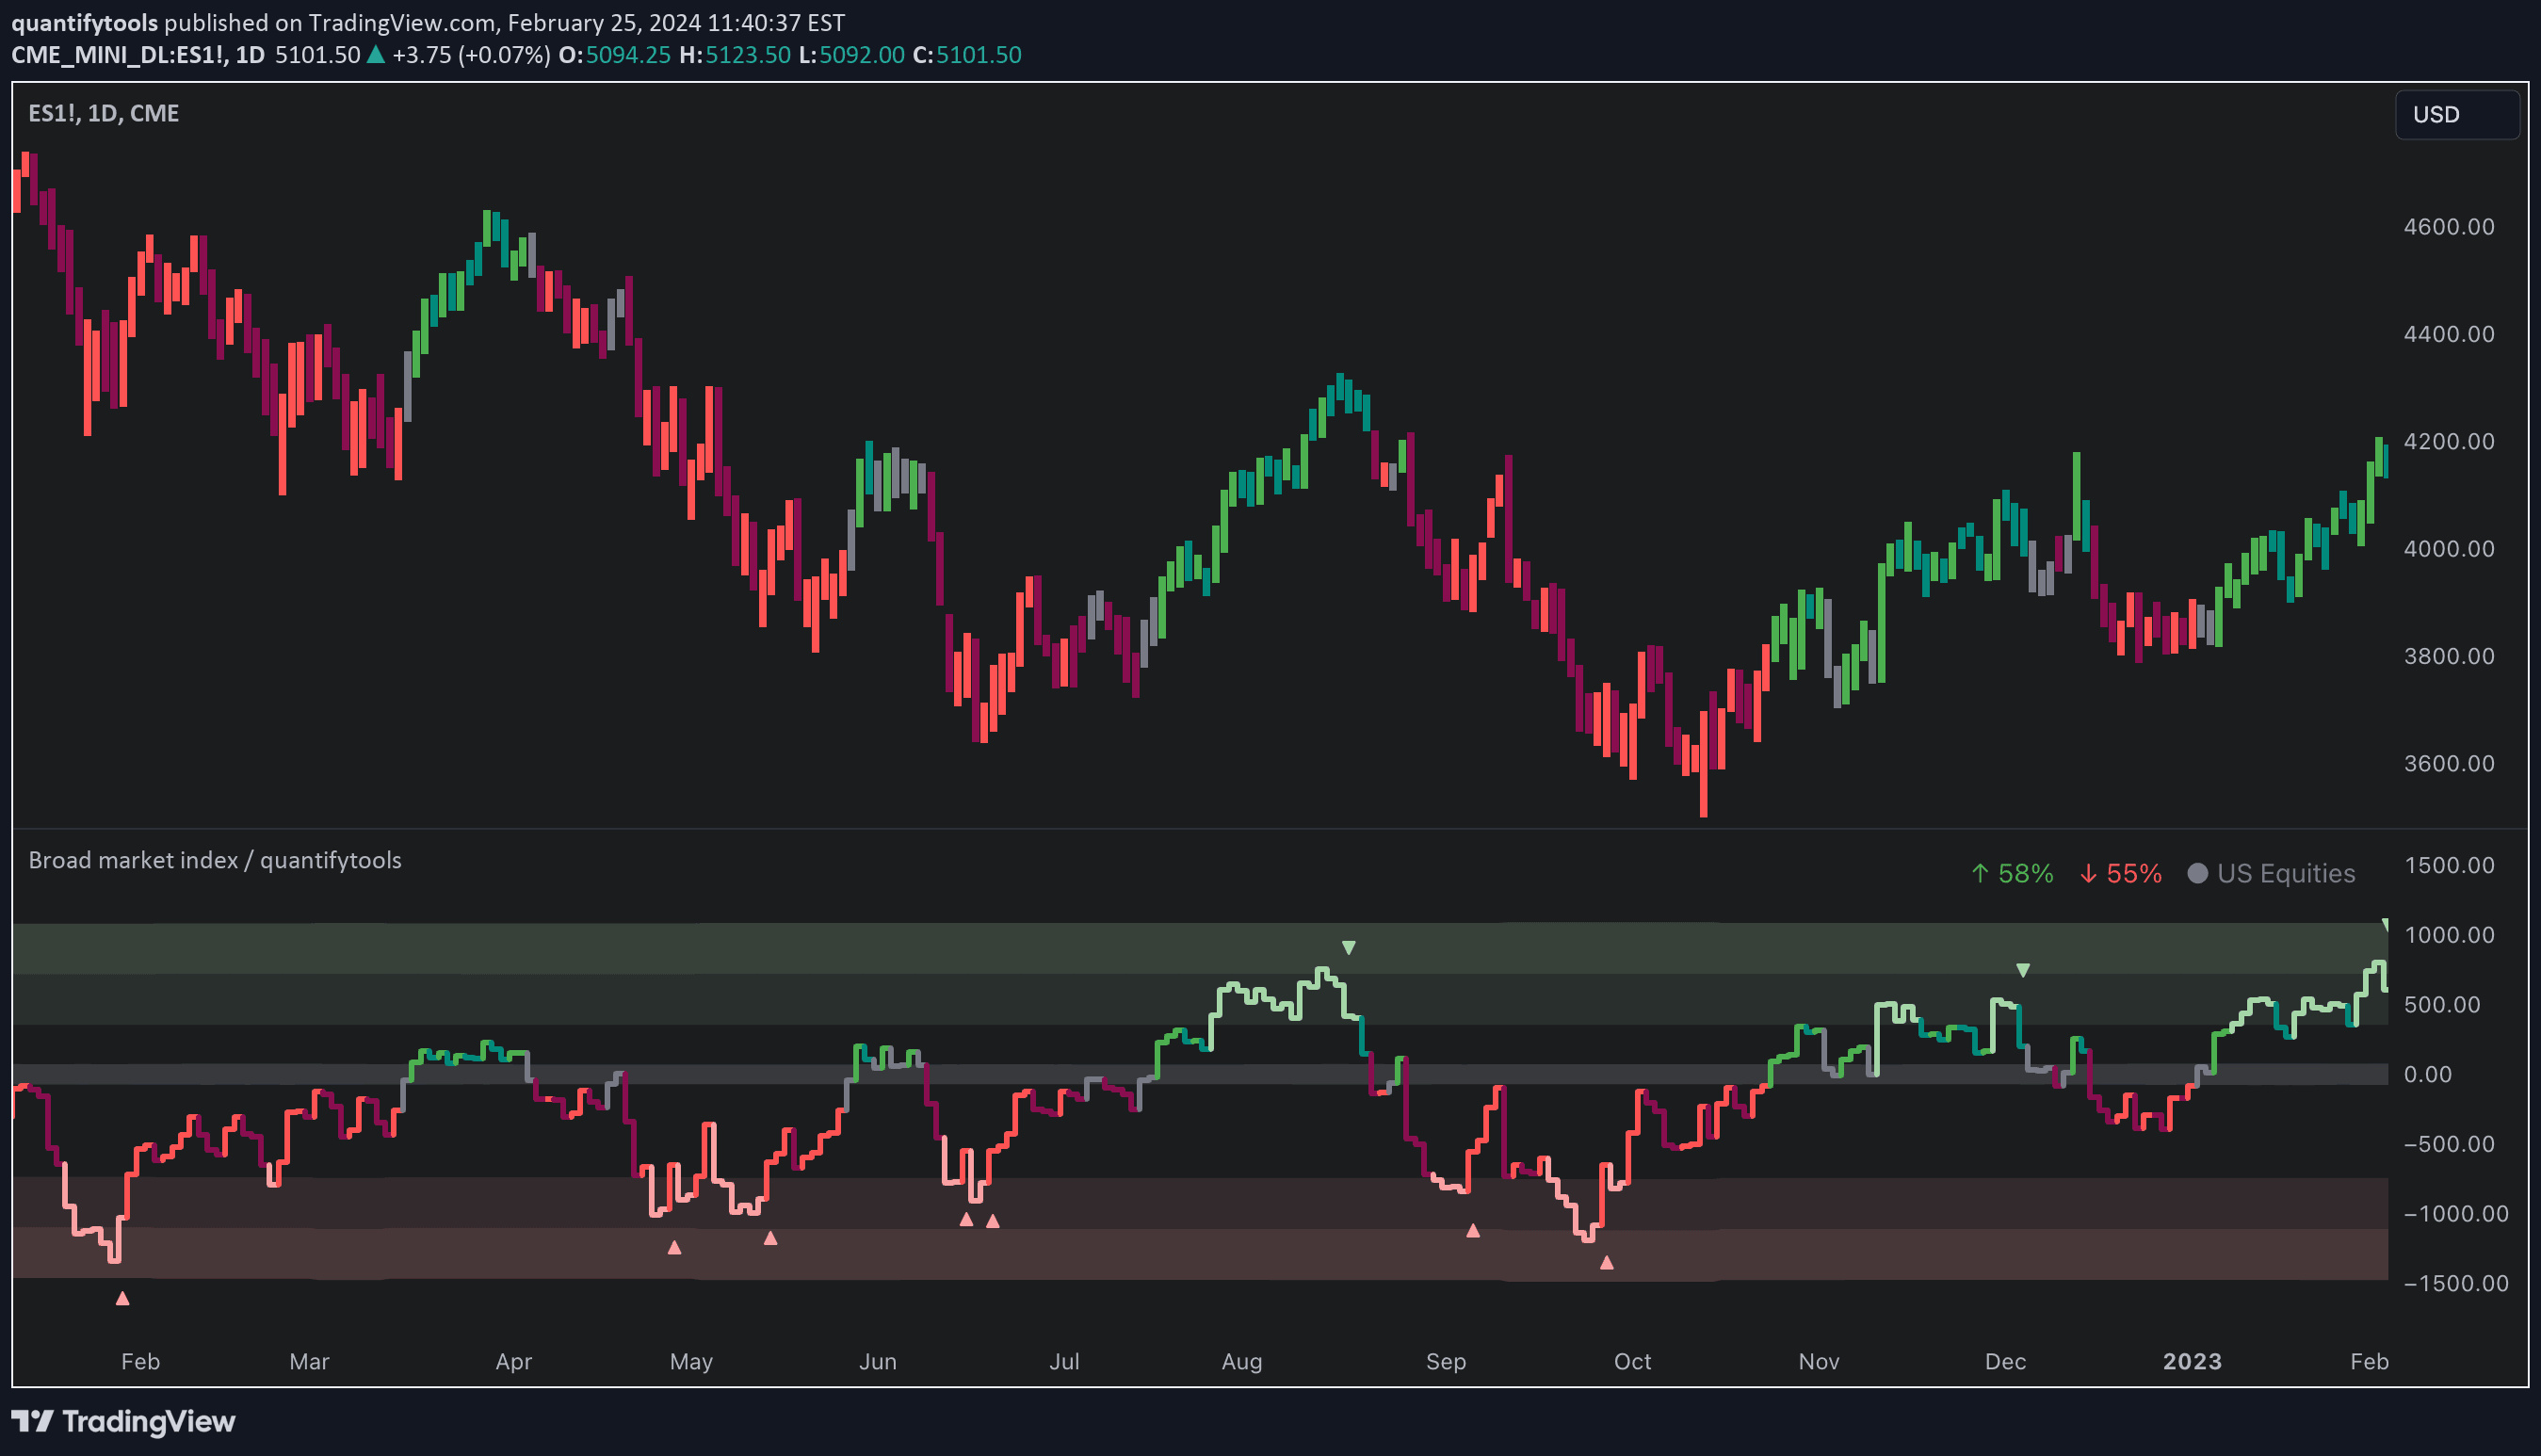
A breadth indicator measuring the percentage of stocks trading above their 50-day moving average to assess market sentiment and identify potential trend shifts.
Explore complementary indicator rolesHow it works
The Percentage above 50-day SMA indicator calculates the proportion of stocks within an index trading above their 50-day simple moving average. By tracking this percentage, traders can gauge the overall market's bullish or bearish momentum across different market indices like NYSE, S&P 500, and Russell indexes.
The indicator uses specific thresholds to signal market conditions: moves above 52.5% are considered bullish, while moves below 47.5% are deemed bearish. Short-term moving averages like the 5-day EMA help identify pullbacks and rebounds within the broader trend, providing traders with nuanced insights into market dynamics.
Why it may be useful
This breadth indicator offers traders a comprehensive view of market sentiment by revealing the underlying strength or weakness across multiple stocks within an index. It helps identify potential trend reversals and provides context beyond individual stock performance, allowing traders to make more informed decisions based on broader market movements.
By understanding the percentage of stocks trading above their moving average, traders can assess market participation, detect potential shifts in momentum, and develop more robust trading strategies that account for overall market conditions rather than relying solely on individual stock performance.
When to explore it
The Percentage above 50-day SMA indicator works best during trending market conditions where clear directional movements are present. Traders should utilize this signal when analyzing broad market indices and seeking to confirm existing trends or potential trend reversals across multiple sectors and market capitalizations.
It is particularly useful when combined with other technical analysis tools, such as long-term and short-term moving averages, to validate trading signals and reduce the risk of entering trades at unfavorable moments. The indicator is most effective for day and swing traders looking to understand market breadth and sentiment.
Keep exploring
What we’ve verified
Access, alerts and repainting behaviour have not been independently verified for this indicator. Check the creator’s current publication and settings.
General descriptions and classifications are recovered research. Verified details above identify the specific checks we have completed. Check the creator’s current publication for later changes.