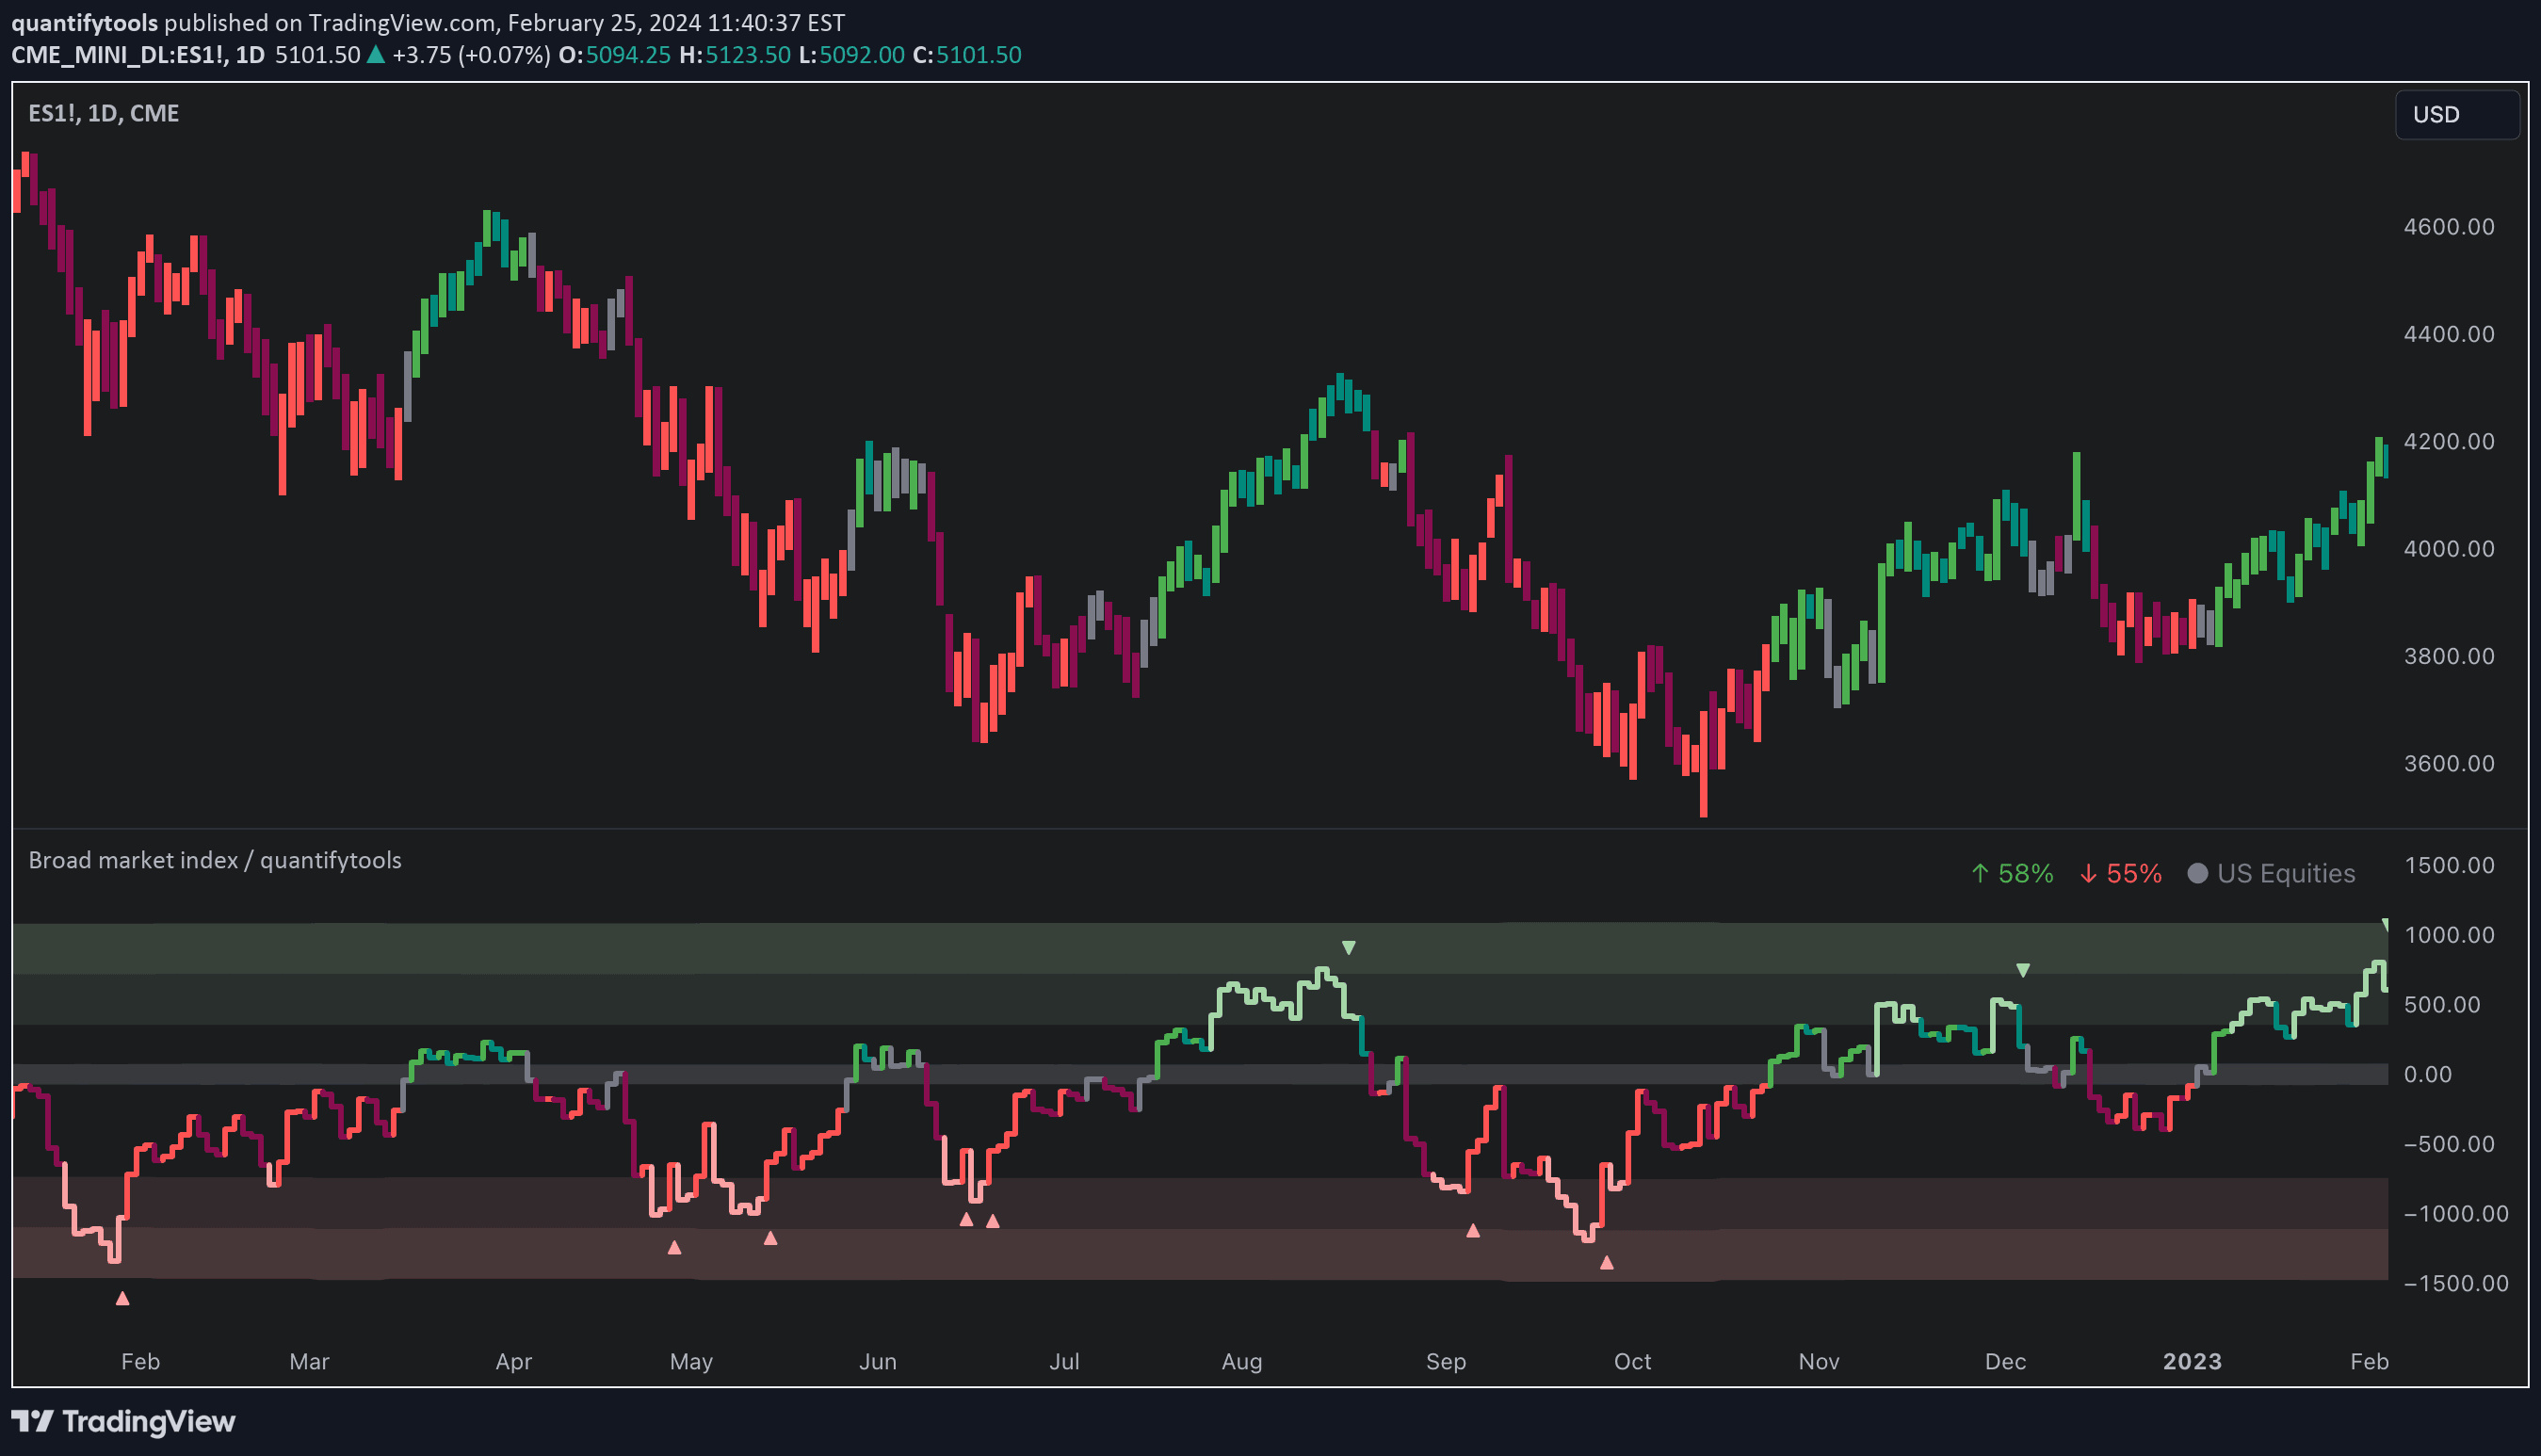
Enhanced McClellan Summation Index
A comprehensive market breadth indicator combining McClellan Summation Index with Heikin-Ashi visualization and MACD analysis to provide advanced trend and momentum insights.
Explore 11,183 indicators. Filter beyond the obvious.
Discover the tools that fit the way you trade.
11,183 tools to explore
A comprehensive market breadth indicator combining McClellan Summation Index with Heikin-Ashi visualization and MACD analysis to provide advanced trend and momentum insights.
Market Breadth Toolkit providing multiple breadth and thrust measures across NYSE and NASDAQ exchanges, detecting market momentum and potential trend changes using advanced technical analysis methods.
Session-based candles track price movements within specific global trading sessions, identifying session reversals and analyzing their performance using historical backtesting metrics.
FINRA's Daily Short Sale Volume indicator tracks short sale transactions for US stocks across NASDAQ, NYSE, and NYSE ARCA, providing insights into trading activity and market sentiment.
Market breadth indicator analyzing the ratio of advancing versus declining symbols to determine overall market trend and potential reversals in broad market movements.
STIX is a market breadth indicator that measures advancing versus declining issues to assess short-term market sentiment and potential overbought or oversold conditions.
The Bolton-Tremblay Index analyzes market trends by tracking advancing, declining, and unchanged securities to provide a comprehensive view of market dynamics and sentiment.
A comprehensive market breadth indicator using McClellan Oscillator, Summation Index, RSI, and MACD to analyze stock market internals and identify potential trend reversals.
The Zahorchak Measure is a market bias indicator that analyzes multiple moving averages of NYSE Composite to determine bullish or bearish market trends with smoothed oscillation.
A trading session indicator that displays and analyzes specific trading periods, helping traders understand market dynamics and potential trading opportunities across different global market sessions.
A market breadth indicator that assesses the strength of advancing stocks and trading volumes to identify potential bullish market momentum and participation.
A technical indicator analyzing NYSE TICK index divergences, displaying market sentiment through various visualization modes and moving average crossovers.
Likes, views, and comments are historical TradingView snapshots. They describe attention, not trading performance.