
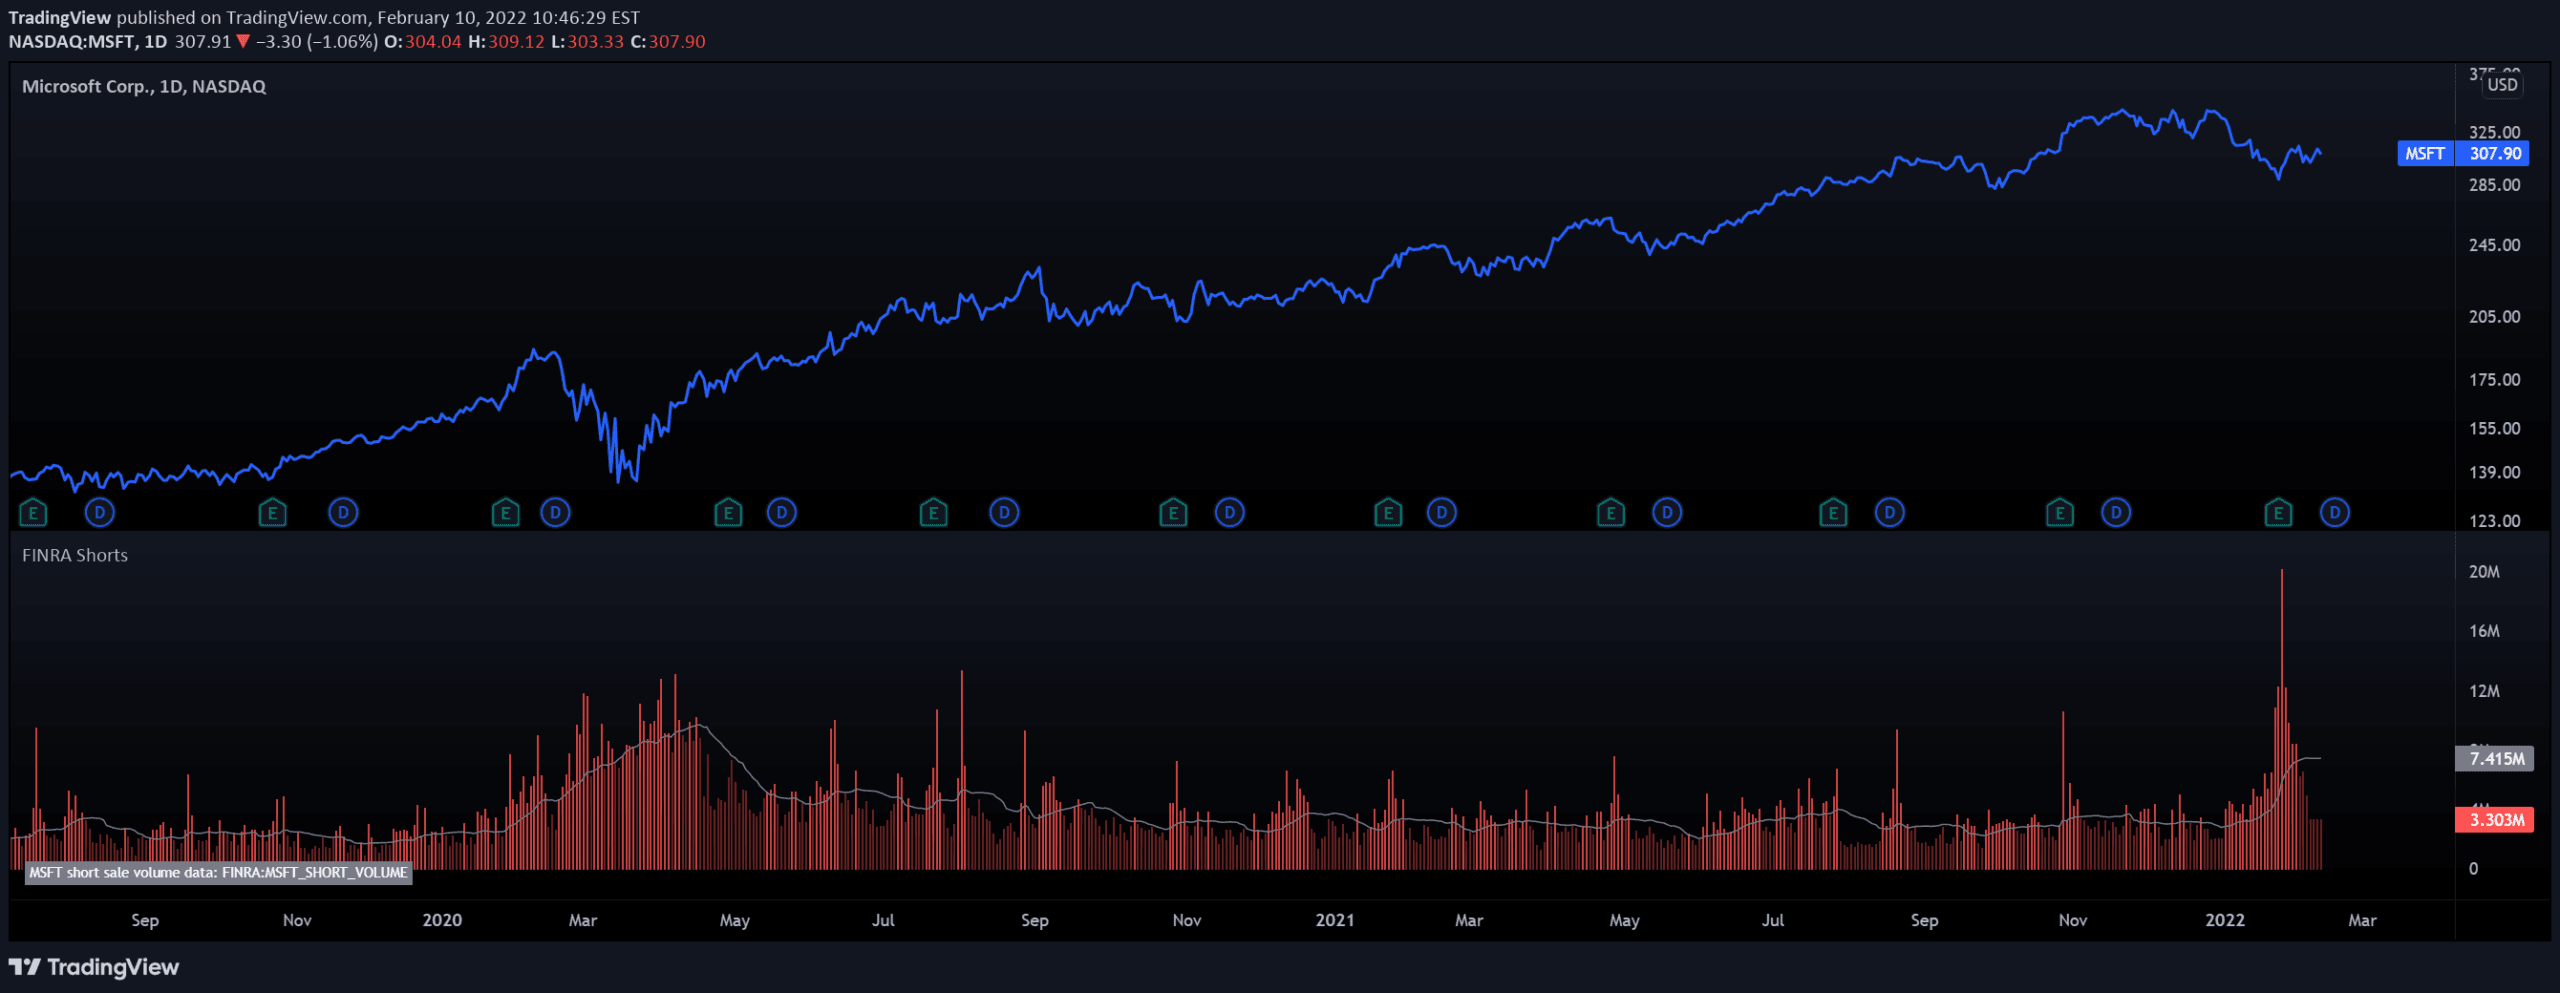
FINRA's Daily Short Sale Volume indicator tracks short sale transactions for US stocks across NASDAQ, NYSE, and NYSE ARCA, providing insights into trading activity and market sentiment.
Explore complementary indicator rolesHow it works
The indicator aggregates daily short sale volume data reported by FINRA during normal market hours. It captures all short trade transactions executed and reported, excluding non-public trading activity.
The data is displayed in columns, with brighter red columns indicating values above the average. Traders can customize the indicator by selecting different symbols and adjusting the moving average length. The indicator provides a visual representation of short selling activity for specific stocks
Why it may be useful
Short sale volume data offers crucial insights into market sentiment and potential price movements. It helps traders understand selling pressure and investor behavior for specific stocks. Unlike short interest, which represents open positions, short sale volume shows actual trading transactions.
The indicator can signal potential trend reversals or confirm existing market trends. By analyzing short sale volumes, traders can gain a deeper understanding of market dynamics and make more informed trading decisions
When to explore it
This indicator is most effective when analyzing stocks traded on NASDAQ, NYSE, and NYSE ARCA. It works best for traders seeking to understand short-selling activity and market sentiment. Use it to complement other technical analysis tools and confirm potential trend changes.
It's particularly useful during periods of market volatility or when evaluating stocks with significant trading activity. Traders can leverage this indicator to identify potential bearish signals or assess overall market sentiment
Keep exploring
What we’ve verified
Access, alerts and repainting behaviour have not been independently verified for this indicator. Check the creator’s current publication and settings.
General descriptions and classifications are recovered research. Verified details above identify the specific checks we have completed. Check the creator’s current publication for later changes.


