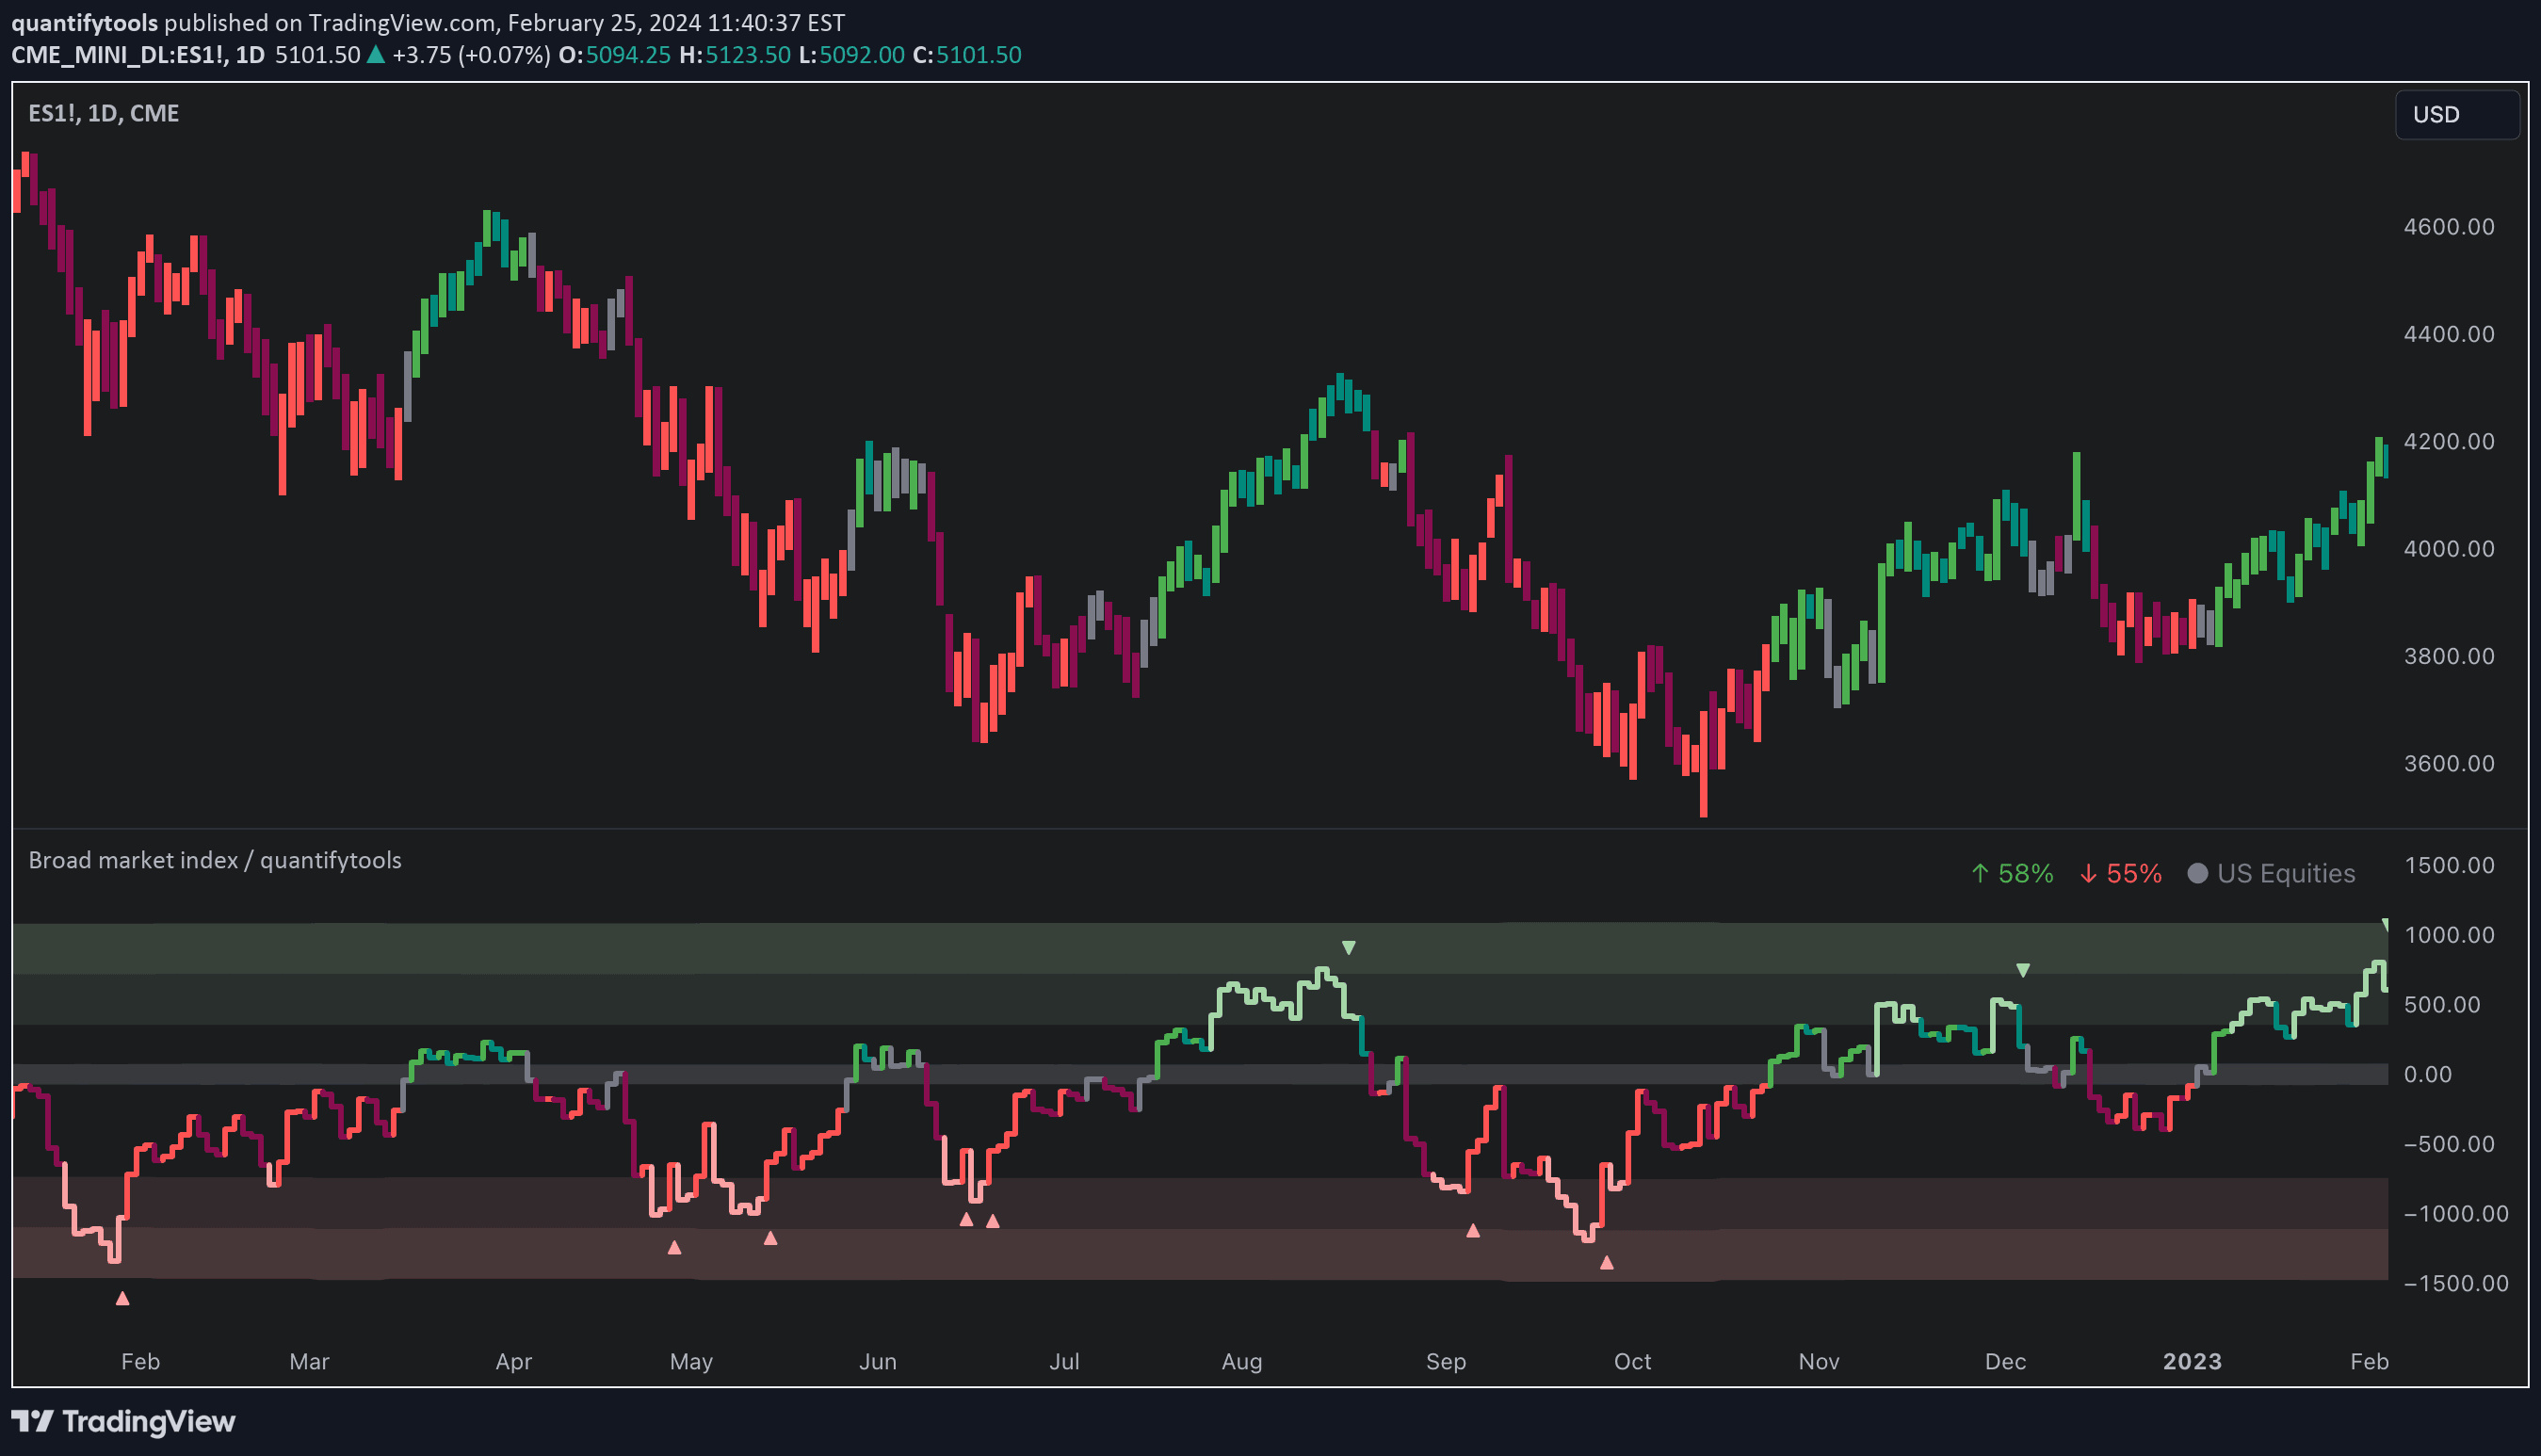
The Bolton-Tremblay Index analyzes market trends by tracking advancing, declining, and unchanged securities to provide a comprehensive view of market dynamics and sentiment.
Explore complementary indicator rolesHow it works
The Bolton-Tremblay Index (BOLTR) calculates a unique ratio by comparing advancing, declining, and unchanged market issues. It uses a mathematical formula that transforms the raw market data into a cumulative index, with the ratio of (ADV - DEC) / UNC determining the index's directional movement.
The index is further enhanced by a Heiken-Ashi transformation, which smooths out the raw data and helps reveal underlying market trends more clearly. This transformation reduces market noise and provides traders with a more refined view of market sentiment and potential trend shifts.
Why it may be useful
The Bolton-Tremblay Index offers traders a sophisticated tool for understanding complex market dynamics beyond simple price movements. By incorporating advancing, declining, and unchanged securities, it provides a more comprehensive assessment of market strength and potential trend reversals.
This indicator helps traders identify subtle shifts in market sentiment that might not be immediately apparent from price charts alone. Its unique methodology allows for a nuanced interpretation of market health, enabling more informed trading decisions and potentially revealing hidden market trends.
When to explore it
The Bolton-Tremblay Index is most effective during periods of market uncertainty or when seeking a broader perspective on market trends. It is particularly useful in volatile market conditions where traditional price-based indicators might provide incomplete information.
Traders can leverage this index during market transitions, sector rotations, or when attempting to gauge overall market sentiment. It is especially valuable for identifying potential trend changes and assessing the underlying strength or weakness of market movements across different timeframes.
Keep exploring
What we’ve verified
Access, alerts and repainting behaviour have not been independently verified for this indicator. Check the creator’s current publication and settings.
General descriptions and classifications are recovered research. Verified details above identify the specific checks we have completed. Check the creator’s current publication for later changes.