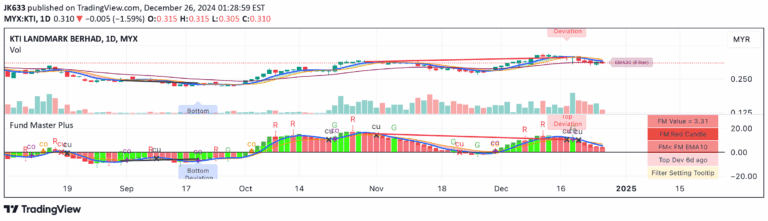
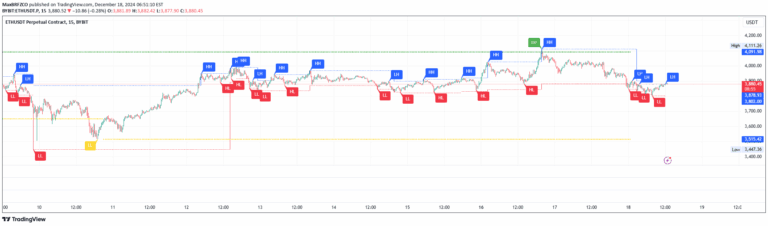
The Zahorchak Measure is a market bias indicator that analyzes multiple moving averages of NYSE Composite to determine bullish or bearish market trends with smoothed oscillation.
Explore complementary indicator rolesHow it works
The Zahorchak Measure calculates market trend by examining multiple moving averages of the NYSE Composite and advance decline line. It uses exponential moving averages of different lengths to create a comprehensive market view.
The indicator oscillates between -10 and +10, with values above zero indicating an uptrend and values below zero signaling a downtrend. By smoothing the original calculation, the indicator reduces market whipsaws while maintaining trend sensitivity. Different moving average lengths can be adjusted to customize the indicator's responsiveness
Why it may be useful
The Zahorchak Measure provides traders with a systematic approach to understanding market trend direction and momentum. By offering a smoothed oscillator, it helps reduce false signals that can mislead traders during volatile market conditions.
The indicator allows flexibility in timeframe and moving average settings, making it adaptable to different trading styles and market environments. Its binary nature of trend identification makes it easy to interpret, helping traders make more informed decisions about market entry and exit points
When to explore it
The Zahorchak Measure works best during trending market conditions with clear directional movements. It is particularly useful for swing traders who want to capture multi-day or multi-week market trends. The indicator is most effective when used in conjunction with other technical analysis tools to confirm trend signals.
Traders should be cautious during sideways or highly volatile markets where trend signals might be less reliable. Adjusting the moving average lengths can help optimize the indicator's performance for specific market characteristics
Keep exploring
What we’ve verified
Access, alerts and repainting behaviour have not been independently verified for this indicator. Check the creator’s current publication and settings.
General descriptions and classifications are recovered research. Verified details above identify the specific checks we have completed. Check the creator’s current publication for later changes.