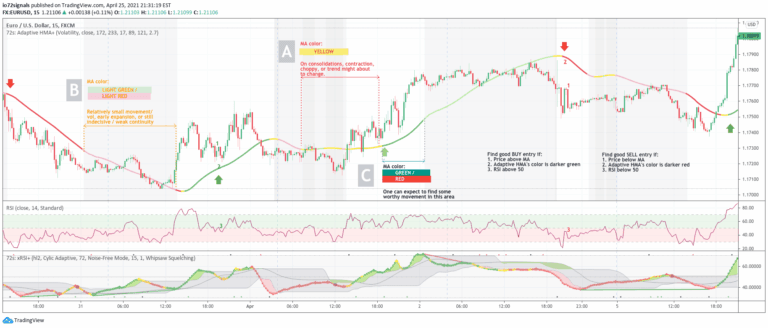
72s: Adaptive Hull Moving Average+
An adaptive Hull Moving Average that dynamically adjusts its period based on volume and volatility, providing clearer trend signals and market condition insights for traders.
Explore 11,183 indicators. Filter beyond the obvious.
Discover the tools that fit the way you trade.
11,183 tools to explore
An adaptive Hull Moving Average that dynamically adjusts its period based on volume and volatility, providing clearer trend signals and market condition insights for traders.
AlphaTrend is a dynamic trend-following indicator that uses Money Flow Index or RSI to generate buy and sell signals based on trend direction and momentum crossovers.
Global Monetary Supply M2 tracks the monetary volume of the world's richest and most populous countries, measuring currency liquidity in USD.
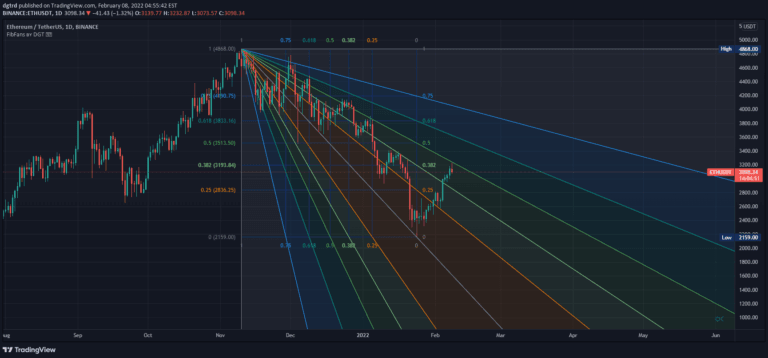
Fibonacci Speed and Resistance Fan is an analytical tool that identifies potential support and resistance levels by drawing lines based on Fibonacci percentages to predict trend changes and market movements.
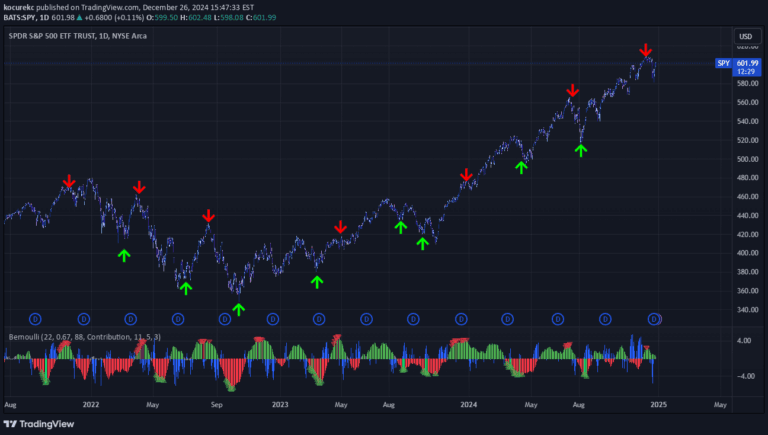
A momentum-based trading signal that measures price changes over time, using speed and acceleration principles to identify potential trend directions and trading setups.
The SMI MFI combines Stochastic Momentum Index and Money Flow Index to measure price momentum and buying/selling pressure, providing insights into market direction and strength.
An interactive ATR-based trailing stop-loss indicator that helps traders manage risk dynamically by adjusting stop-loss levels based on market volatility and price movement.
A binary entropy function using price and volume to measure information content and generate trading signals based on statistical measurement of market movements and potential trend shifts.
A market analysis tool that identifies market structure, grid levels, and volume distribution to help traders visualize trading activity and measure price movements across different ranges.
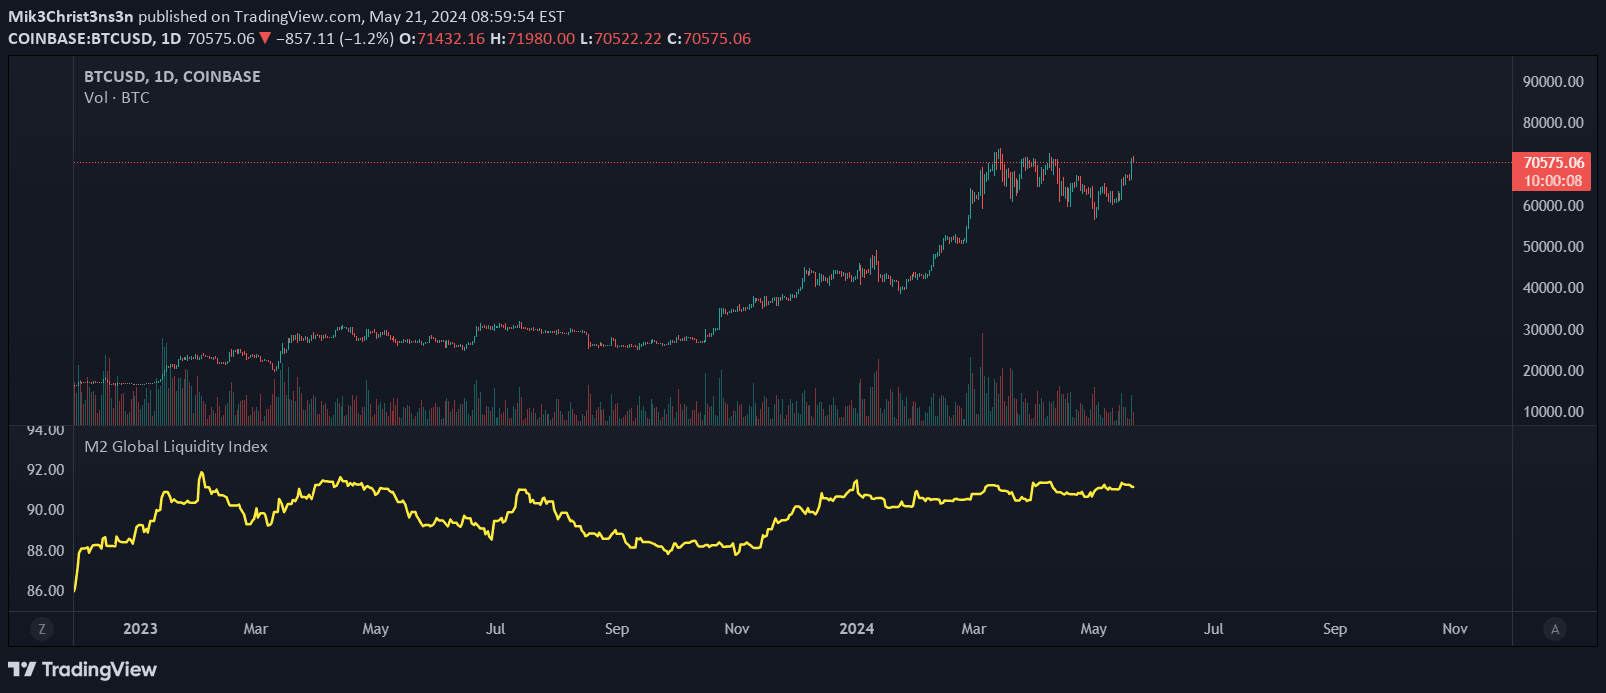
The M2 Global Liquidity Index tracks aggregate money supply across five major currencies, providing a comprehensive view of global economic liquidity and potential market trends.
A volatility indicator using VIX to measure price deviation from VWAP, primarily designed for SPY. It calculates standard deviation moves based on implied volatility, helping traders understand potential price ranges.
A comprehensive trading tool that visualizes swing ranges, provides real-time support and resistance levels, and offers dynamic insights into market movements and trading opportunities.
Likes, views, and comments are historical TradingView snapshots. They describe attention, not trading performance.