
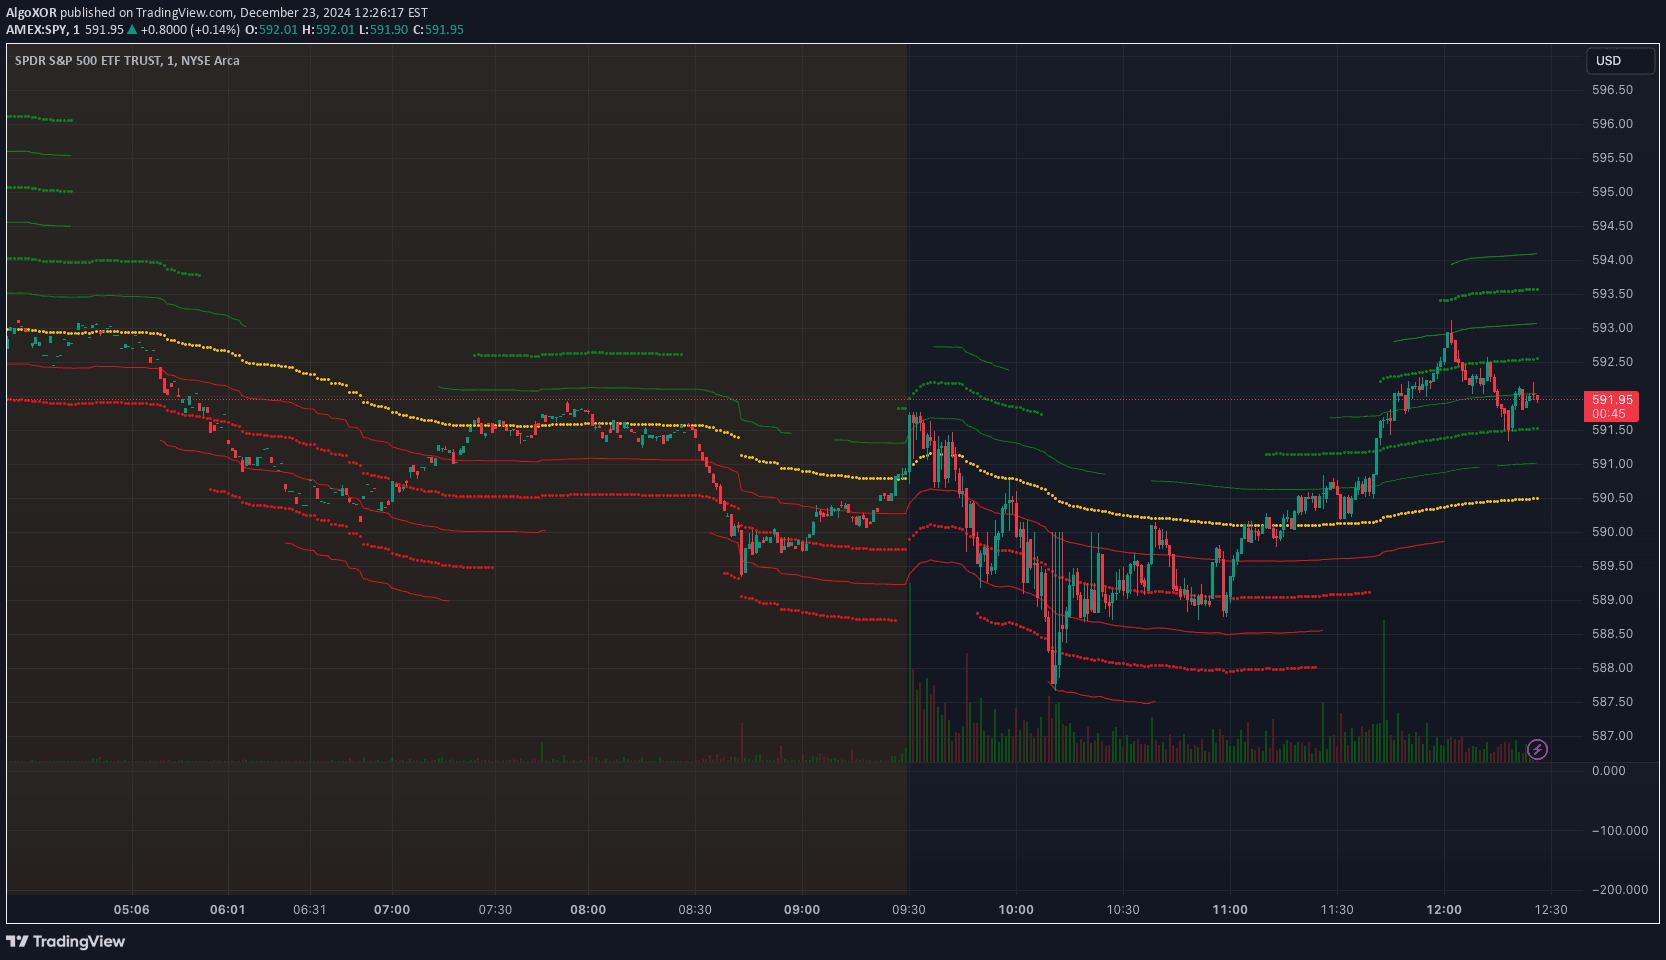
A volatility indicator using VIX to measure price deviation from VWAP, primarily designed for SPY. It calculates standard deviation moves based on implied volatility, helping traders understand potential price ranges.
Explore complementary indicator rolesHow it works
This indicator calculates price movements using standard deviations from the Volume Weighted Average Price (VWAP) based on the VIX index. It uses the VIX as a proxy for implied volatility over a 30-day period. By measuring the expected move of SPY, the indicator plots potential price range levels at 1 and 2 standard deviation points.
These levels help traders understand potential price expansion or contraction based on current market volatility. The calculation involves using VIX data to determine potential price movement boundaries around the VWAP
Why it may be useful
This indicator provides traders with a dynamic view of potential price ranges based on market volatility. It helps traders understand potential market movement limits and assess risk more effectively. By using VIX as a volatility proxy, traders can anticipate potential price expansions or contractions.
The standard deviation levels offer clear visual markers for potential support and resistance zones. It gives traders a more nuanced understanding of market conditions beyond simple price action. The indicator is particularly useful for options traders and those trading SPY or correlated instruments
When to explore it
This indicator is most effective when trading SPY or instruments strongly correlated with the S&P 500. It works best during periods of known market volatility or uncertainty. Traders should use it during day trading and swing trading scenarios where understanding potential price ranges is crucial.
It's particularly useful during earnings seasons, economic announcements, or periods of significant market events. The indicator can help set more informed stop-loss and take-profit levels. Traders should combine it with other technical and fundamental analysis for comprehensive market assessment
Keep exploring
What we’ve verified
Access, alerts and repainting behaviour have not been independently verified for this indicator. Check the creator’s current publication and settings.
General descriptions and classifications are recovered research. Verified details above identify the specific checks we have completed. Check the creator’s current publication for later changes.


