
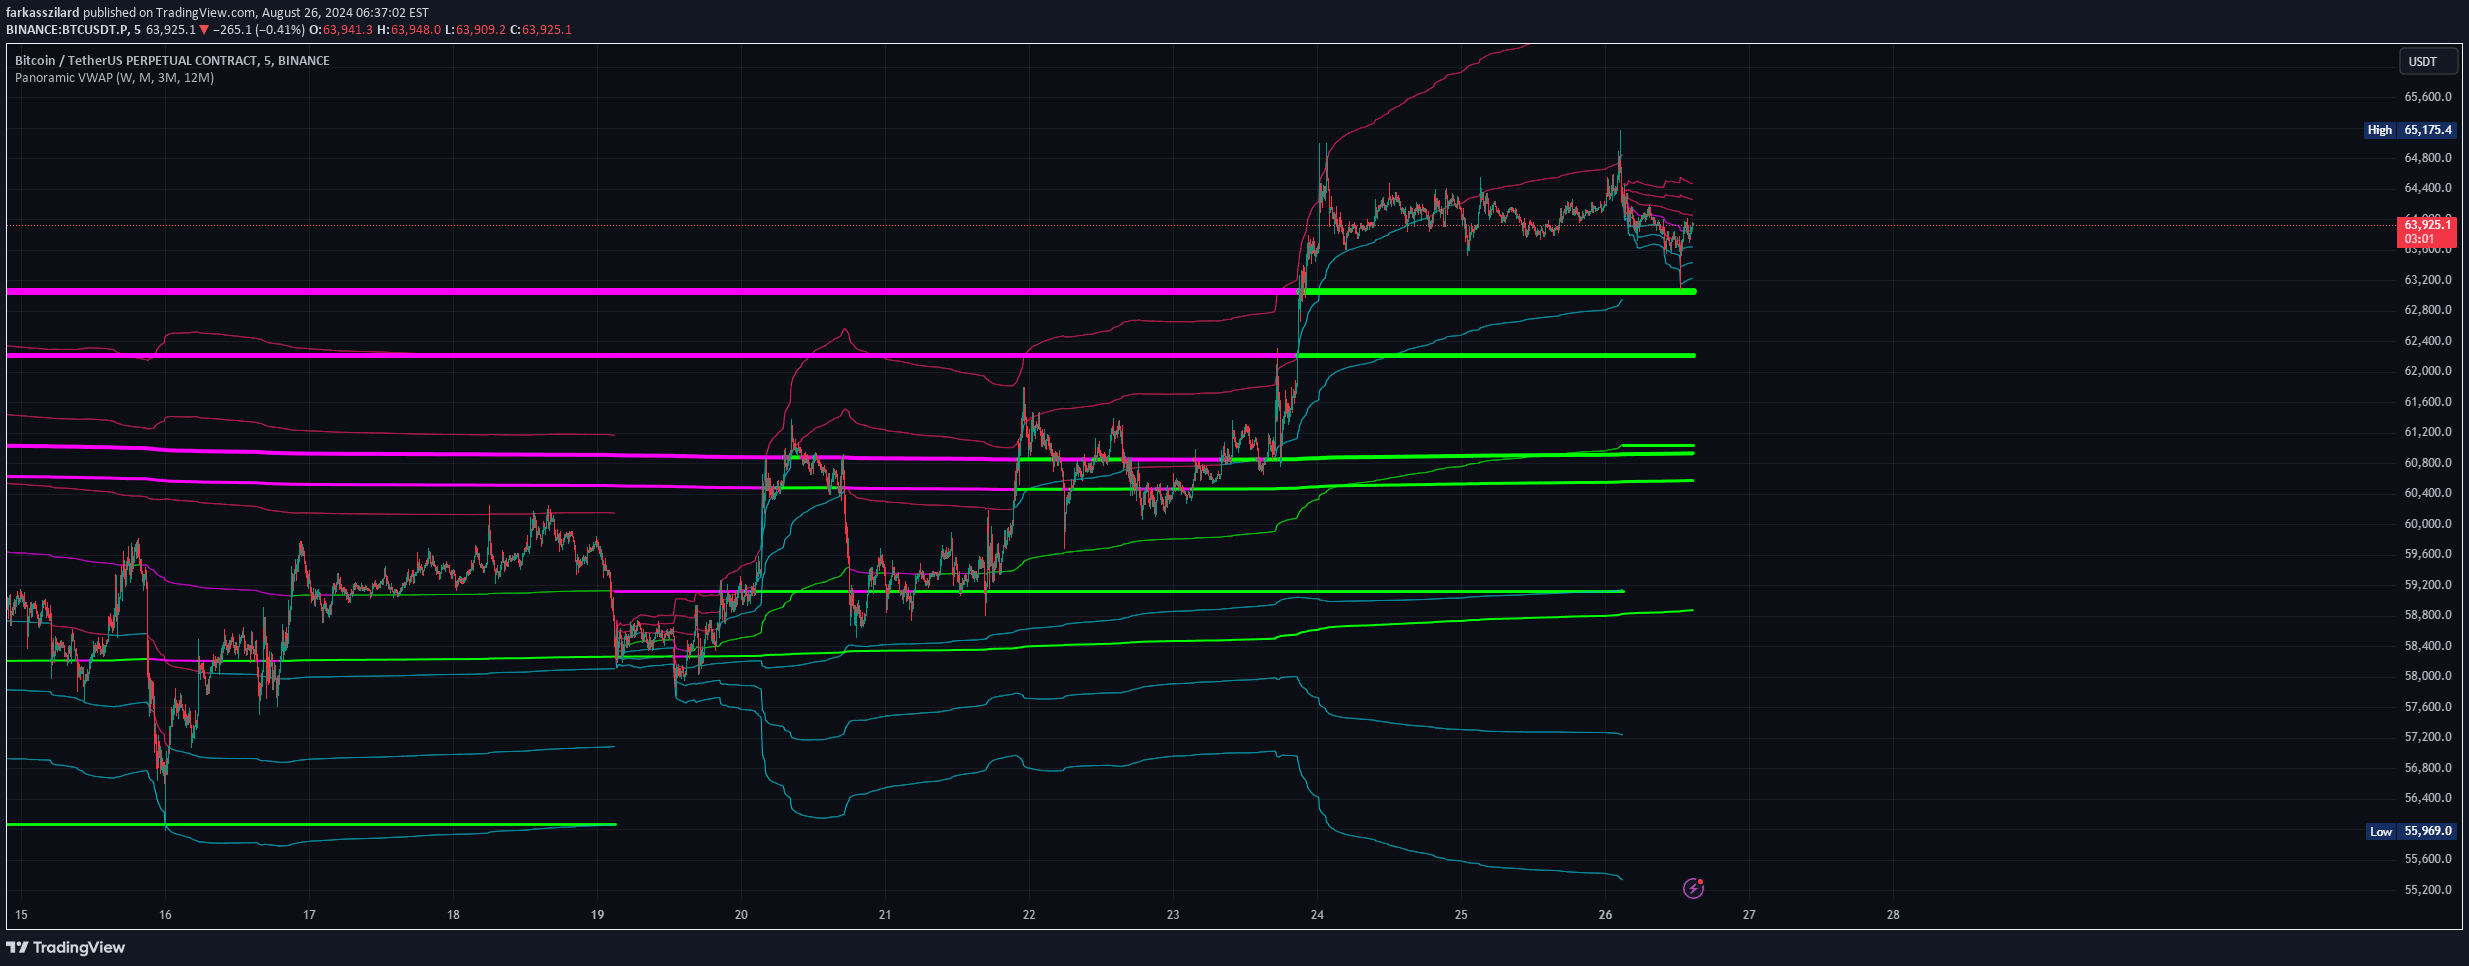
A multi-timeframe VWAP indicator that displays up to four Volume Weighted Average Price lines with standard deviation bands, helping traders analyze price trends and momentum across different time horizons.
Explore complementary indicator rolesHow it works
The Panoramic VWAP Indicator calculates Volume Weighted Average Price lines by integrating price and volume data across multiple timeframes. It creates up to four VWAP lines, each representing a different time horizon, which dynamically adjust based on market conditions.
The indicator also generates optional standard deviation bands around each VWAP line, providing visual representation of price volatility. These bands help traders identify potential support and resistance levels, overbought or oversold conditions, and gauge the market's price movement relative to the average weighted price.
Why it may be useful
The Panoramic VWAP Indicator offers traders a comprehensive view of price action by simultaneously displaying multiple VWAP lines across different timeframes. This multi-dimensional approach allows traders to understand market dynamics more holistically, revealing potential trend shifts and momentum changes that might be missed on a single timeframe.
By incorporating standard deviation bands and close lines, the indicator provides additional context for price movements, helping traders make more informed decisions about entry, exit, and risk management strategies.
When to explore it
The Panoramic VWAP Indicator is most effective during periods of consistent trading volume and when seeking to analyze price trends across multiple time horizons. It works particularly well in markets with clear directional movements, helping traders identify potential support and resistance levels and assess momentum shifts.
Traders can utilize this indicator in various market conditions, from intraday scalping to swing trading and long-term trend analysis. It is especially useful when looking to confirm trend strength, evaluate potential reversal points, and understand price behavior relative to volume-weighted average prices.
Keep exploring
What we’ve verified
Access, alerts and repainting behaviour have not been independently verified for this indicator. Check the creator’s current publication and settings.
General descriptions and classifications are recovered research. Verified details above identify the specific checks we have completed. Check the creator’s current publication for later changes.


