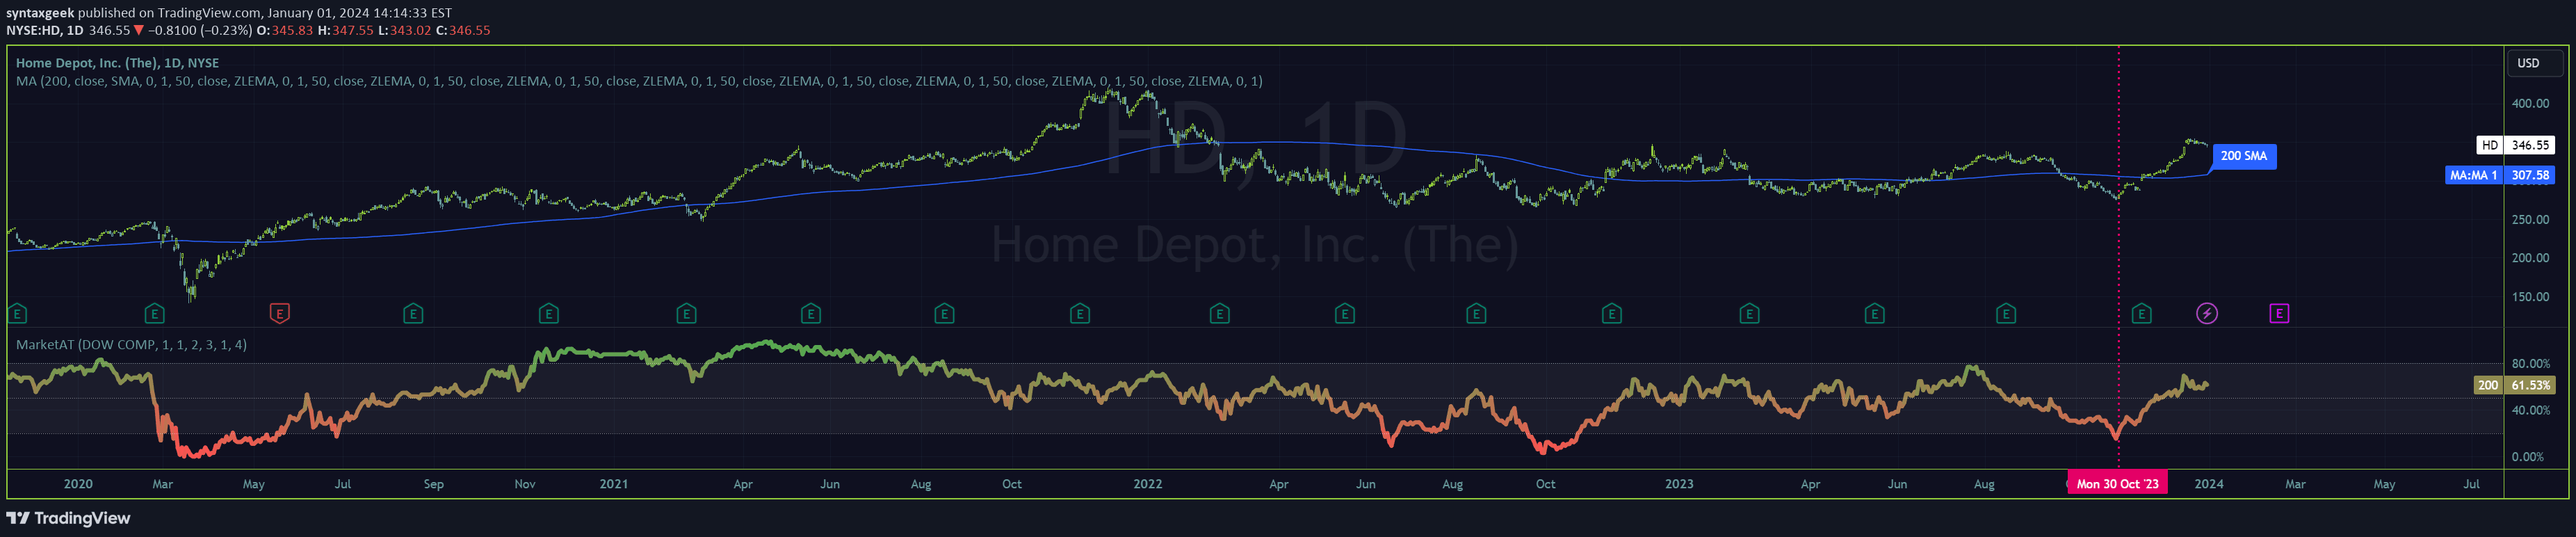
Breadth Indicators NYSE Percent Above Moving Average
A breadth indicator measuring the percentage of stocks trading above their 50-day moving average to assess market sentiment and identify potential trend shifts.
Explore 11,183 indicators. Filter beyond the obvious.
Discover the tools that fit the way you trade.
11,183 tools to explore
A breadth indicator measuring the percentage of stocks trading above their 50-day moving average to assess market sentiment and identify potential trend shifts.
A breadth indicator tracking the percentage of stocks trading above their 5-day moving average across major indices, revealing market sentiment and potential overbought or oversold conditions.
A comprehensive market breadth indicator that tracks stock index strength across multiple moving average timeframes, helping traders assess market sentiment and potential entry points.
A comprehensive correlation indicator tracking relationships between major market instruments like DXY, GC, CL, ES, RTY, and ZN, providing insights into market interconnectedness and potential trading signals.
A Pine Script indicator designed to measure bar tail and wick lengths on daily futures charts, providing precise measurements of market movement for individual candles.
A dynamic market momentum indicator that tracks cumulative 52-week high-low movements across multiple indices, using customizable moving averages to identify trend shifts and market sentiment.
A statistical index futures spread indicator that uses Z-score normalization to detect pricing discrepancies between futures contracts and their corresponding cash indices.
A comprehensive market value indicator that adjusts major US stock market indices for inflation and currency strength, providing a real-time view of true market performance.
Likes, views, and comments are historical TradingView snapshots. They describe attention, not trading performance.