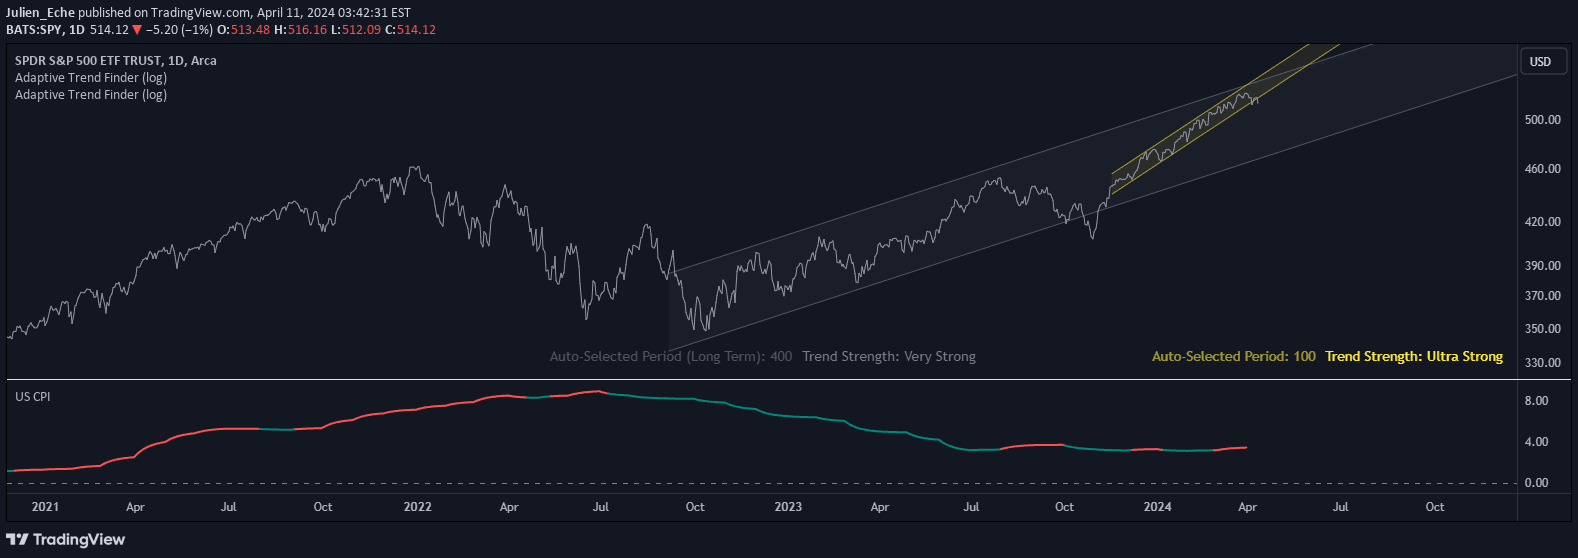
A comprehensive market value indicator that adjusts major US stock market indices for inflation and currency strength, providing a real-time view of true market performance.
Explore complementary indicator rolesHow it works
The indicator calculates a composite index by averaging the prices of four major US stock market indices: S&P 500, NASDAQ, Dow Jones, and Russell 2000. It then applies a sophisticated adjustment mechanism using two critical economic factors: the US Consumer Price Index (CPI) and the US Dollar Index (DXY).
This adjustment process involves dividing the composite index by the CPI and DXY multiplied by 100, which effectively normalizes the market value. By incorporating these economic metrics, the indicator provides a more nuanced view of market performance that goes beyond simple price movements.
Why it may be useful
Traditional market indices can be misleading because they don't account for the underlying economic factors that impact real investment value. This indicator bridges that gap by providing a comprehensive view that reflects true market performance after accounting for inflation and currency fluctuations.
By adjusting for these critical economic variables, investors gain a more accurate understanding of market trends, helping them make more informed investment decisions. It allows traders to distinguish between nominal price increases and genuine economic growth.
When to explore it
This indicator is most valuable during periods of significant economic change, such as times of high inflation or notable currency value fluctuations. It is particularly useful for investors seeking to understand the underlying market dynamics beyond surface-level price movements.
Traders and investors can leverage this indicator when comparing market performance across different time periods, especially when evaluating long-term investment strategies or assessing the real impact of economic shifts on market valuations.
Keep exploring
What we’ve verified
Access, alerts and repainting behaviour have not been independently verified for this indicator. Check the creator’s current publication and settings.
General descriptions and classifications are recovered research. Verified details above identify the specific checks we have completed. Check the creator’s current publication for later changes.