CE - 42MACRO Equity Factor Table
A comprehensive market analysis tool tracking cross-market correlations and equity factor performance across multiple assets to provide probabilistic insights into macro market regimes and potential future movements.
Explore 11,183 indicators. Filter beyond the obvious.
Discover the tools that fit the way you trade.
11,183 tools to explore
A comprehensive market analysis tool tracking cross-market correlations and equity factor performance across multiple assets to provide probabilistic insights into macro market regimes and potential future movements.
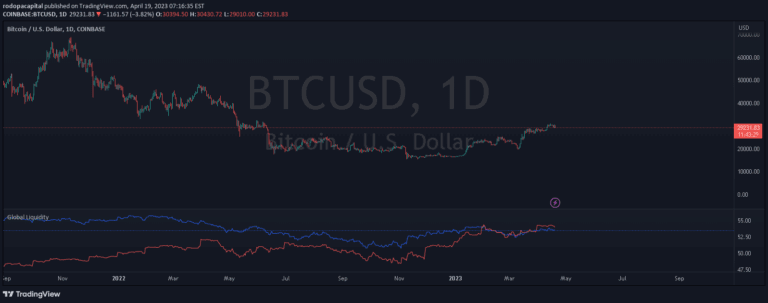
Global Liquidity indicator tracks money supply across major economies, plotting regional liquidity values to help traders understand global economic trends and potential investment opportunities.
The Investment Clock Orbital Graph is a macro trading tool that visualizes economic cycles by tracking GDP growth and CPI inflation rates across different market phases.
A comprehensive macro analysis tool tracking multiple assets and market regimes to provide insights into market performance, risk states, and potential economic trends.
The Shiller PE Ratio is a long-term market valuation indicator that measures stock prices relative to inflation-adjusted 10-year average earnings for the S&P 500.
CAPE ratio is a long-term valuation measure that smooths earnings over ten years, helping investors assess market valuations and identify potential investment opportunities.
A comprehensive market analysis tool tracking 15 ETFs to provide insights into market trends, performance, and macroeconomic regime positioning across different economic environments.
A sophisticated Fibonacci tool that helps traders identify key support and resistance levels through linear and logarithmic levels, and Fibonacci fans for comprehensive market analysis.
A comprehensive economic indicator aggregation tool that normalizes multiple financial metrics to provide a holistic view of market conditions and economic health.
Treasury Yields Heatmap is a dynamic tool tracking bond values and yield curve status across different countries using Pearson's linear regression coefficient.
A global monetary supply indicator that compares worldwide money printing rates to GDP growth, offering insights into global economic dynamics and potential market implications.
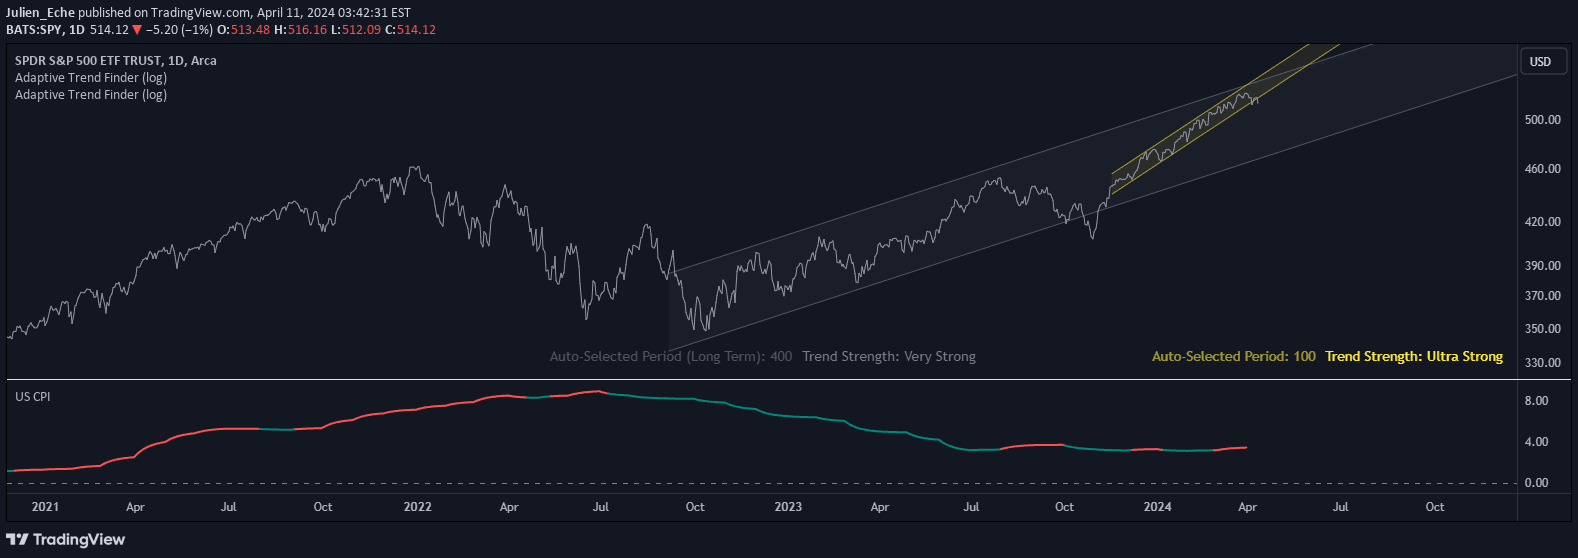
The US CPI indicator tracks inflation rates by analyzing changes in consumer prices, providing crucial economic insights for traders and investors monitoring economic health.
Likes, views, and comments are historical TradingView snapshots. They describe attention, not trading performance.