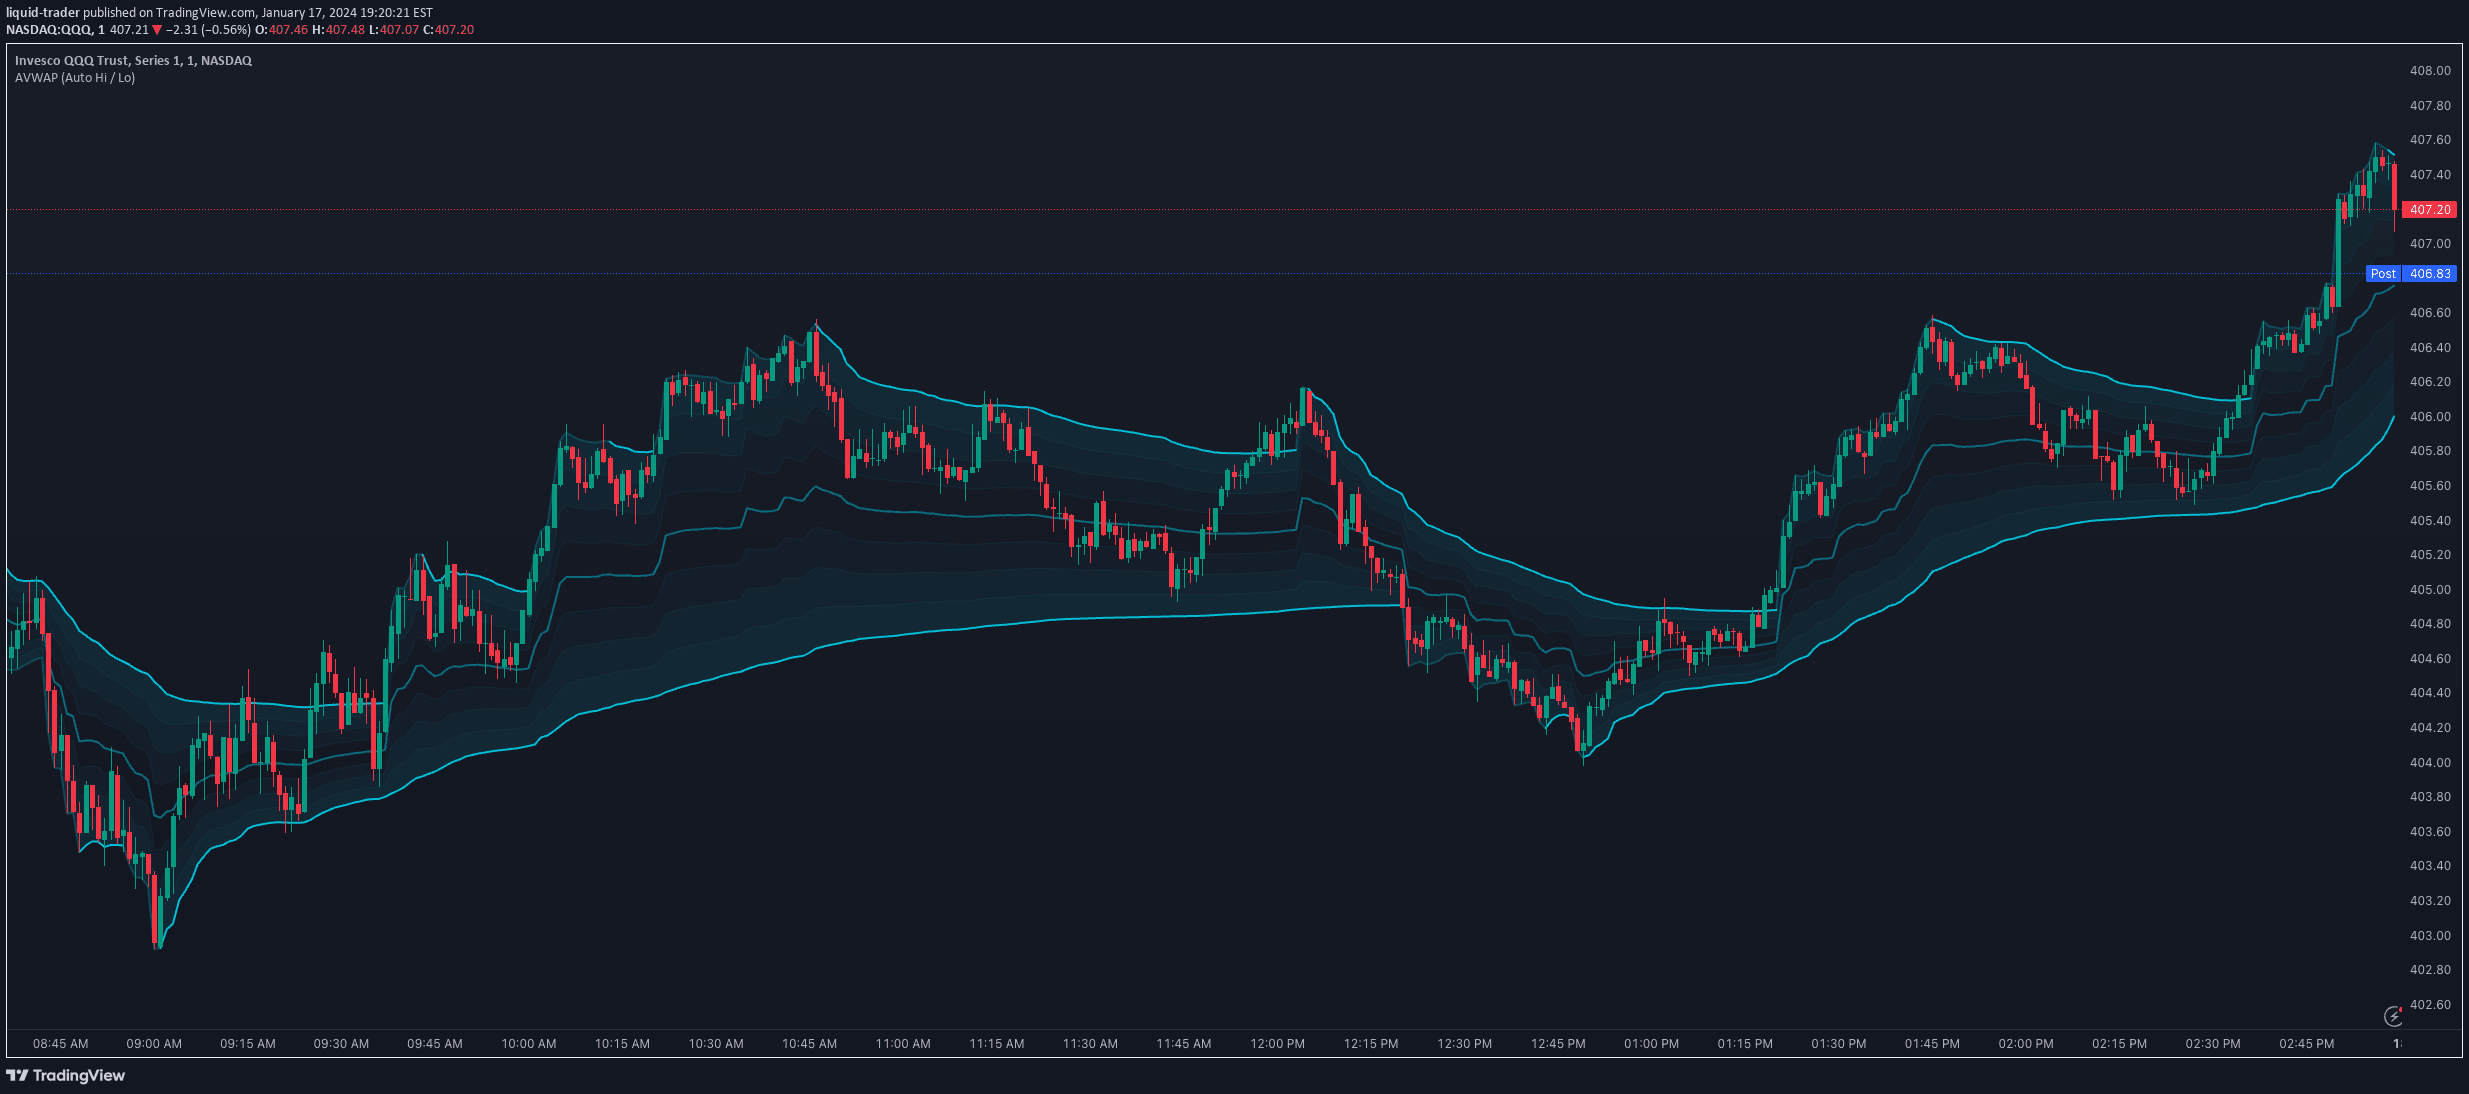
VWAP is a volume-weighted average price indicator that smooths price data and provides trend insights by analyzing price movement relative to trading volume.
Explore complementary indicator rolesHow it works
The VWAP indicator calculates a volume-weighted average price by multiplying each price point by its corresponding trading volume and then dividing by the total volume traded during the period. It uses a 14-period simple moving average to create a smoother representation of price movement, which helps filter out market noise and provide a clearer trend visualization.
The indicator dynamically colors its line based on market trend analysis, using the highs and lows from the last 10 days to determine whether the market is in an uptrend (blue), downtrend (pink), or no defined trend (light yellow). This color-coding provides traders with an immediate visual indication of the current market condition.
Why it may be useful
The VWAP is crucial for traders because it offers a more nuanced view of price movement by incorporating trading volume into the average price calculation. By weighting price points according to their trading volume, it provides a more accurate representation of the true market sentiment and helps traders understand the underlying strength of price movements.
Its ability to smooth out market volatility and provide clear trend indications makes it an invaluable tool for traders seeking to make more informed trading decisions. The dynamic color-coding and trend analysis features help traders quickly assess market conditions and potential trading opportunities.
When to explore it
The VWAP is most effective in markets with significant trading volume and during periods of clear trending behavior. It works particularly well for intraday trading strategies, where traders can use the indicator to identify potential entry and exit points based on price movements relative to the VWAP line.
Traders should pay special attention to moments when candlesticks strongly cross the VWAP line, as these can signal potential trend reversals or continuation. For instance, a candlestick breaking above the VWAP might suggest a long entry opportunity, while a candlestick breaking below could indicate a potential short entry point.
Keep exploring
What we’ve verified
Access, alerts and repainting behaviour have not been independently verified for this indicator. Check the creator’s current publication and settings.
General descriptions and classifications are recovered research. Verified details above identify the specific checks we have completed. Check the creator’s current publication for later changes.