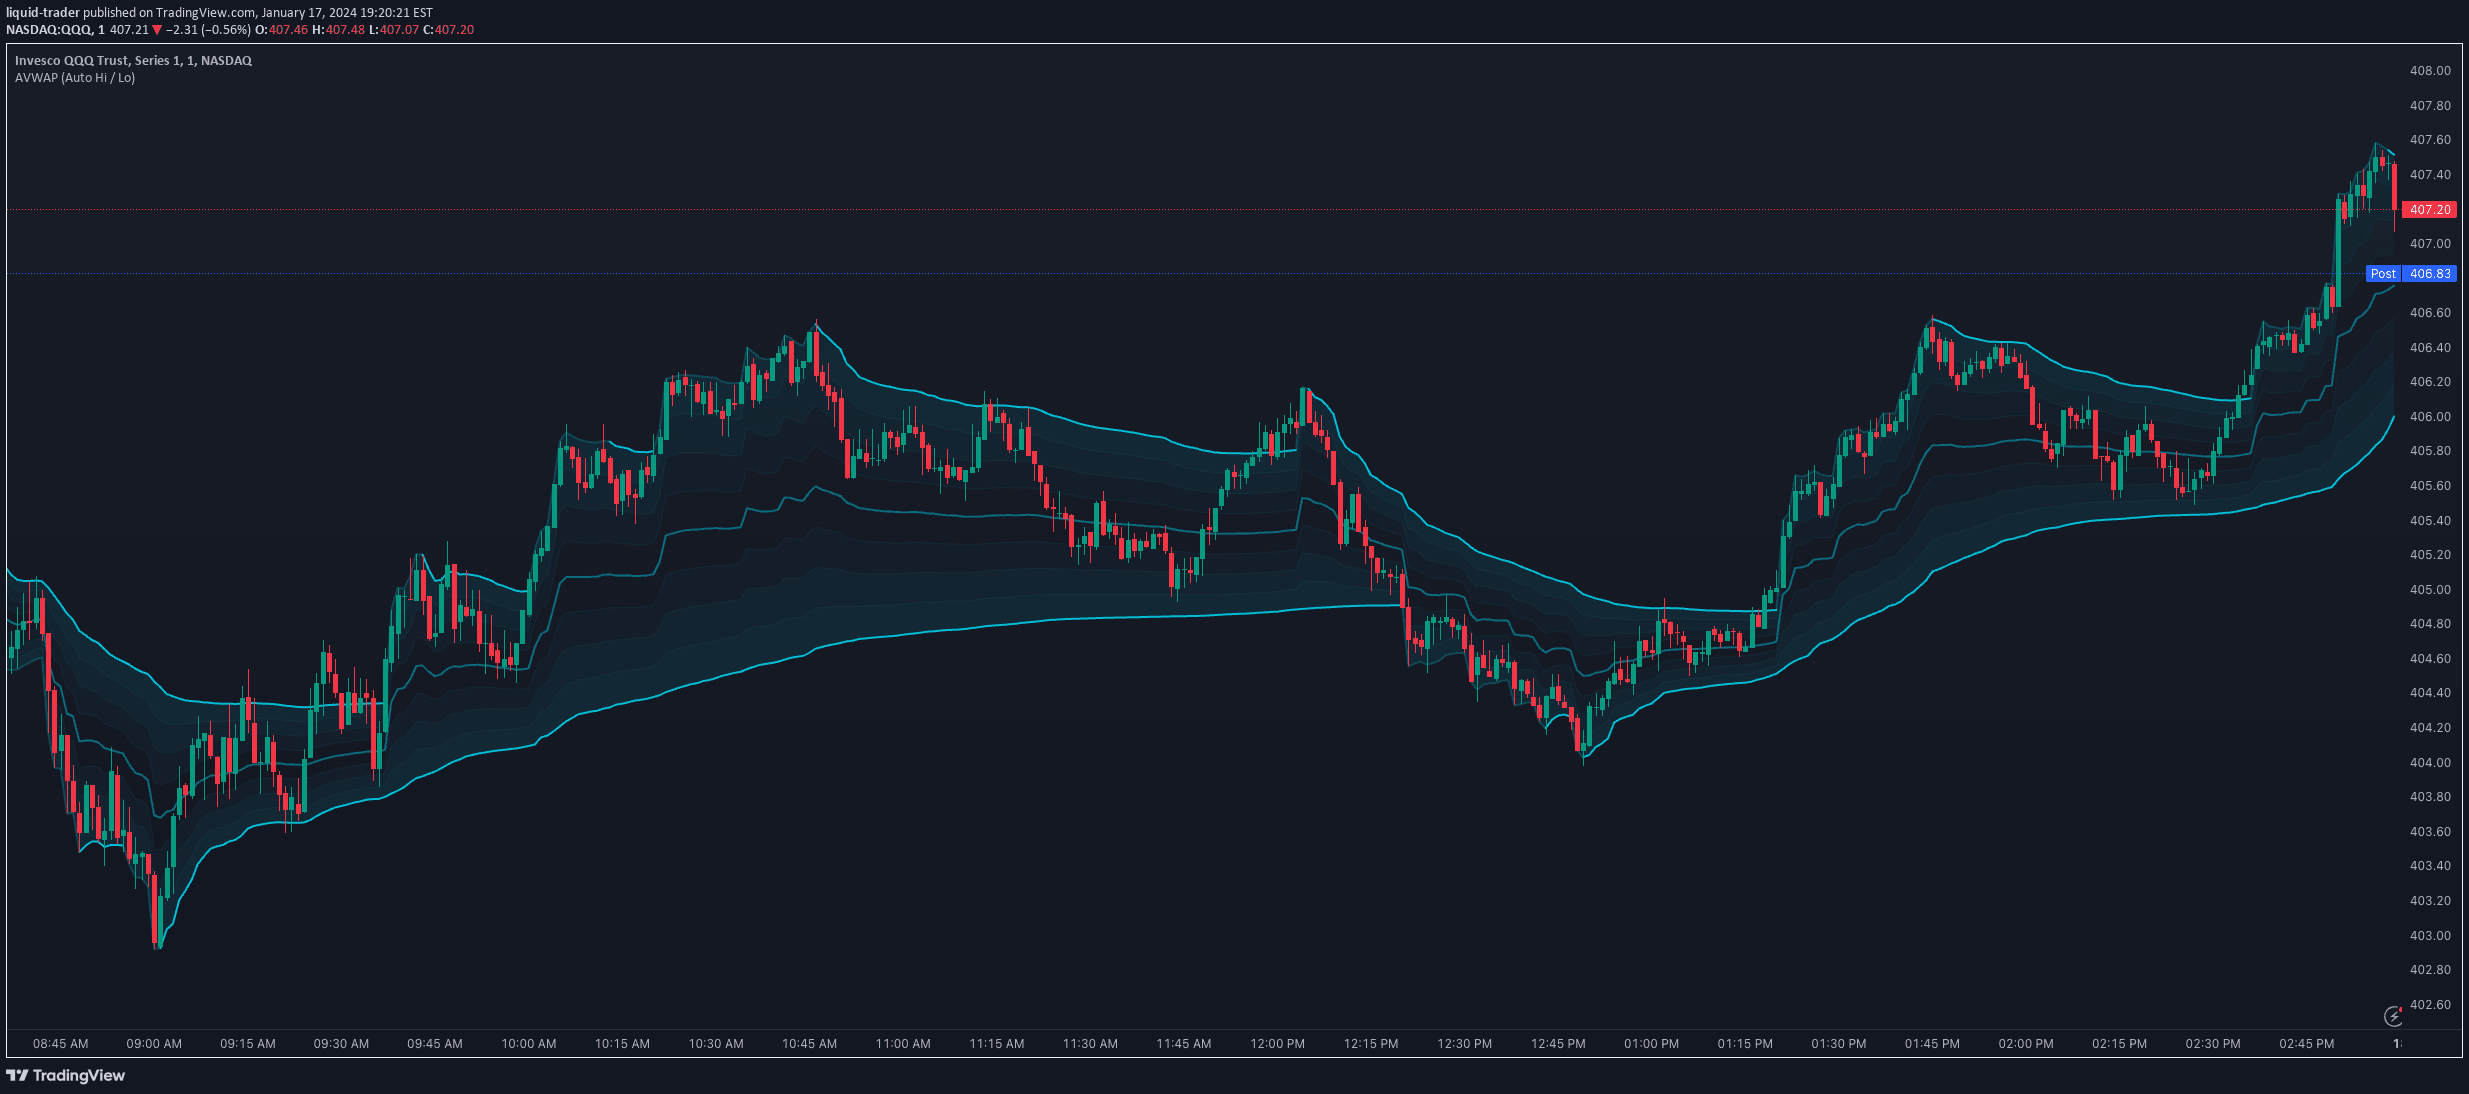
A Volume Weighted Average Price (VWAP) indicator that visualizes price trends using standard deviation bands, helping traders identify support, resistance, and market momentum.
Explore complementary indicator rolesHow it works
The VWAP indicator calculates the average price a security has traded at throughout the day, weighted by trading volume. It plots a central line representing the volume-weighted average price and creates standard deviation bands around this line using multipliers that expand the bands.
These standard deviation bands help traders visualize price volatility and potential support/resistance levels. By adjusting the standard deviation multipliers, traders can customize the width of these bands to match their specific trading strategy and market conditions.
Why it may be useful
VWAP provides traders with a dynamic benchmark that reflects both price and volume, offering insights into market sentiment and potential price movements. It helps identify optimal entry and exit points by showing where prices are trading relative to the average volume-weighted price.
The standard deviation bands offer additional context about market volatility, allowing traders to make more informed decisions about potential trend reversals, momentum, and price targets. By understanding these bands, traders can develop more sophisticated strategies for managing risk and capturing trading opportunities.
When to explore it
VWAP is most effective during intraday trading, particularly in highly liquid markets with significant trading volume. It works best for traders seeking to understand short-term price dynamics and identify potential trend confirmations or reversals within a single trading session.
Traders can utilize VWAP most effectively when combining it with other technical indicators like moving averages or Bollinger Bands. It is particularly useful for momentum trading, pullback strategies, and institutional-style trading approaches that require precise price and volume analysis.
Keep exploring
What we’ve verified
Access, alerts and repainting behaviour have not been independently verified for this indicator. Check the creator’s current publication and settings.
General descriptions and classifications are recovered research. Verified details above identify the specific checks we have completed. Check the creator’s current publication for later changes.