Trading Zones based on RS / Volume / Pullback
A trading indicator that identifies strategic trading zones for long trades by analyzing price movements, relative strength, and potential entry and exit points.
Explore 11,183 indicators. Filter beyond the obvious.
Discover the tools that fit the way you trade.
11,183 tools to explore
A trading indicator that identifies strategic trading zones for long trades by analyzing price movements, relative strength, and potential entry and exit points.
A comprehensive swing trading indicator that provides adaptive moving averages, price contraction detection, resistance line tracking, and detailed trading information across multiple timeframes.
A Pine Script indicator that analyzes financial performance by tracking EPS, sales growth, and stock price changes to help traders make informed investment decisions.
A comprehensive trading indicator combining EMA, pivot points, volume analysis, and volatility contraction patterns to provide multi-dimensional market insights and potential entry signals.
A trading strategy combining Volatility Contraction Pattern (VCP) and Pocket Pivots to identify potential breakout opportunities by analyzing price consolidation and volume surges.
A comprehensive quarterly earnings tracker that helps investors identify potential multibagger stocks by analyzing financial performance, growth metrics, and technical positioning.
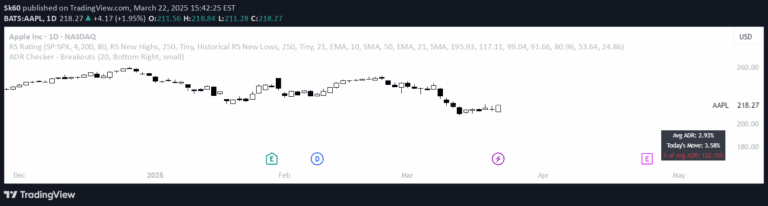
ADR Checker is a visual tool that helps traders assess a stock's daily price movement relative to its average range, providing critical insights for momentum and breakout trading strategies.
A trading strategy that identifies potential market shakeouts by analyzing price action, volume surges, and institutional trading patterns to spot high-probability entry points.
Likes, views, and comments are historical TradingView snapshots. They describe attention, not trading performance.